The purpose is the followings;
If the consistency is enough, we can use the Pandel function instead of using the huge Photonics tables. If not, I will try to find a better function to express the Photonics tables.
At first, I checked the difference between Photonics and UPandel function. Electromagnetic showers of different energies are used.
The blue points represent UPandel function, the black green and red points represent Photonics tables. The Photonics tables are not symmetrical, but it depends on the OM position. The black, green and red represents +x, +z and -z direction, respectively. The energy is 10^19 eV.
The agreement between the Photonics and the UPandel function is not so bad, though there are some difference (~factor 2), depending on the OM position with respect to the cascade vertex. (There is the difference for the z axis, but symmetrical for x and y directions. The UPandel function is symmetrical for any direction.)
Up-going case (Photonics 1.4)
Down-going case (Photonics 1.5)
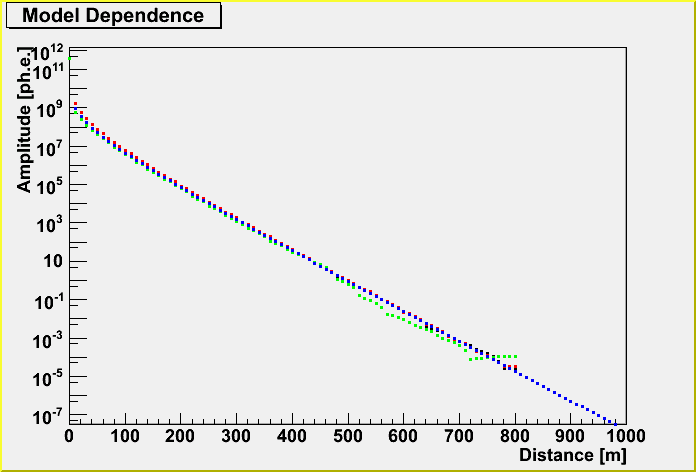
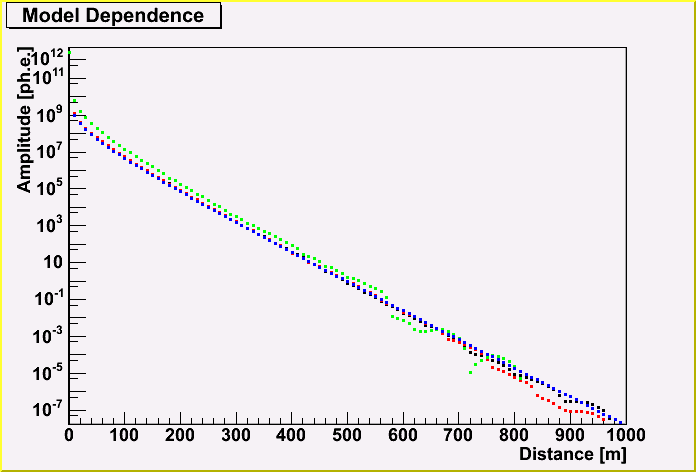
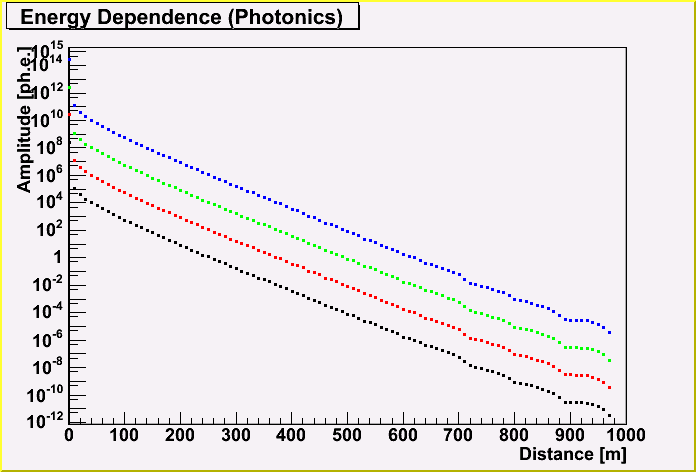
Here, The energy dependence of the amplitude for Photonics is shown. The black, red, green and blue points are for 10^15, 10^17, 10^19 and 10^21 eV, respectively. (The x direction)
The good news is that there is not so much ph.e. beyond 700 m from the cascade vertex.
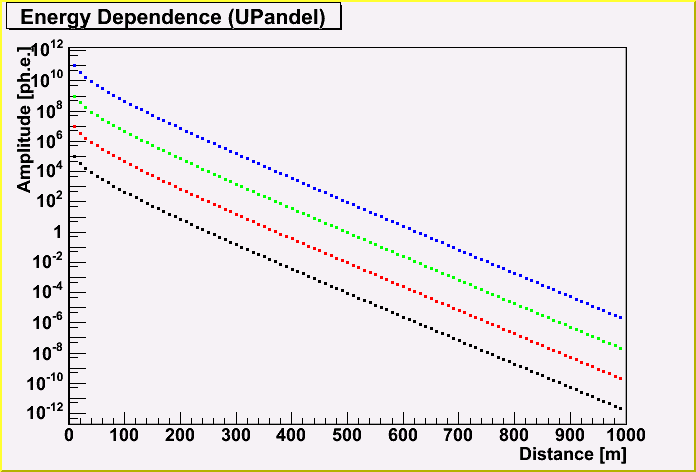
This is the same for UPandel function.
The below plot shows the difference between Photonics (x direction) and UPandel function, depending on the energy. Concerning to the comparison between the x direction of Photonics and UPandel function, they agree well with each others.
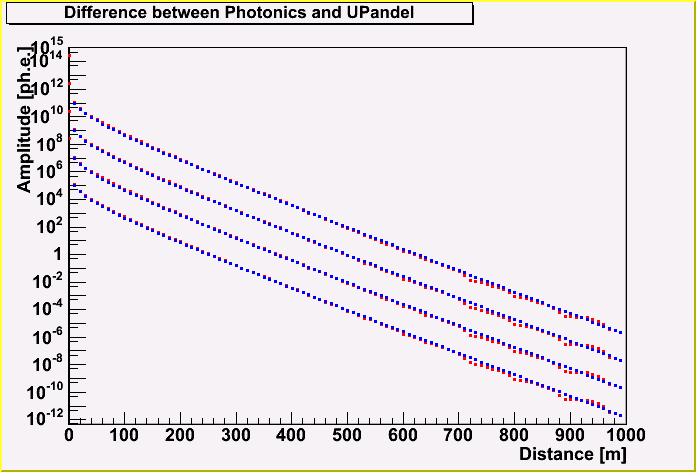
As same as above, let me show a plot which shows the difference between Photonics and UPandel function. The blue poitns are UPandel, and black, green and red points are Photonics (+x, +z and -z respectively).
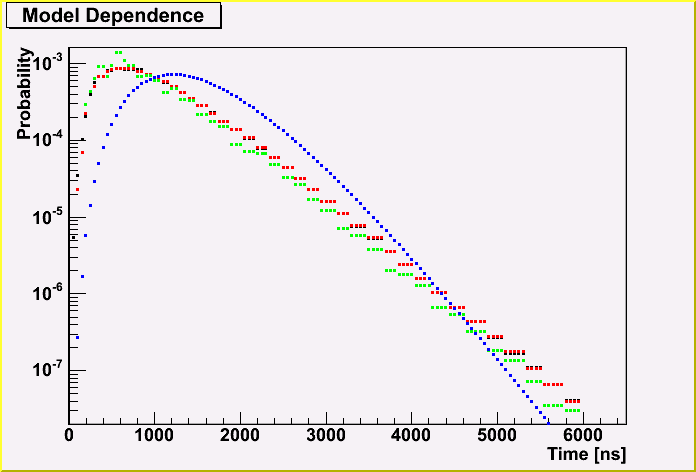
This distributions don't depend on the energy, but do on the distance from the cascade vertex to a OM position. In this case, the distance is 200 m from the vertex point.
Here, we can see the difference between the Photonics and the UPandel function. There are small difference, depending on the OM positions, but the difference is smaller than the case of the amplitude.
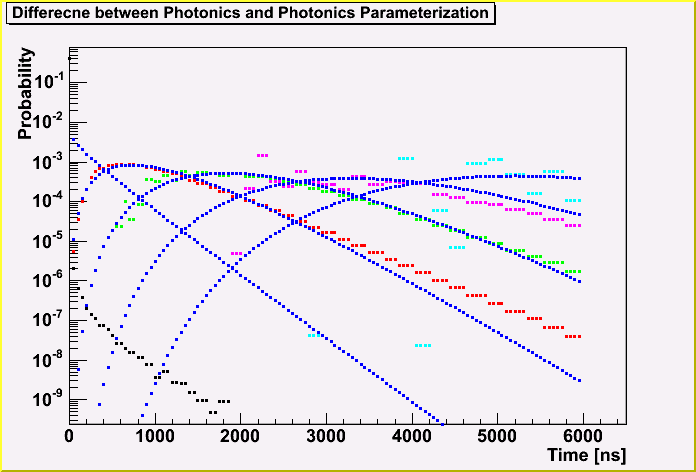
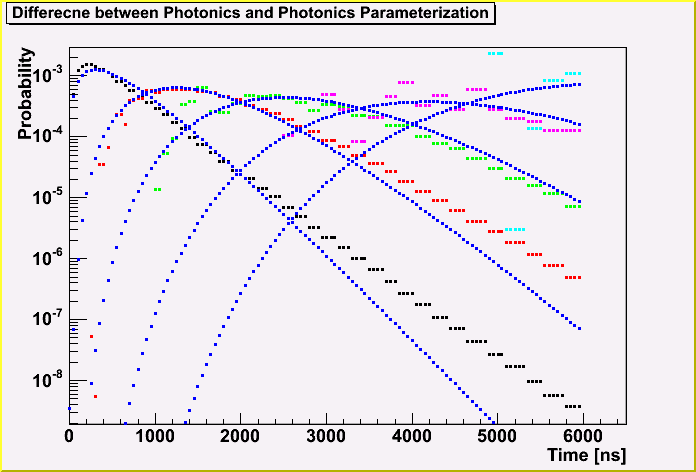
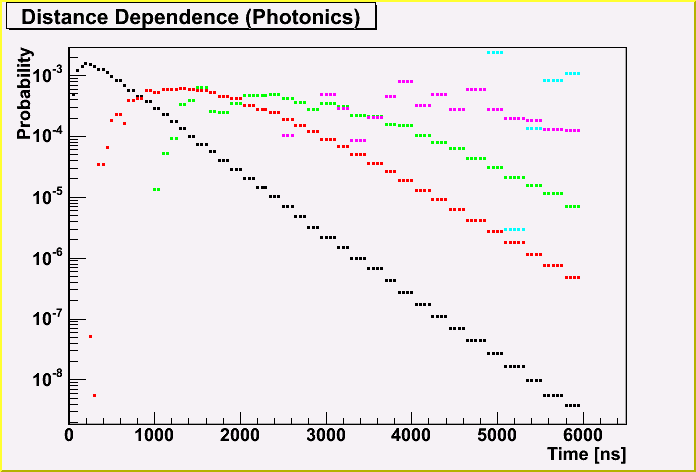
The next plot shows the distance dependence. This is for Photonics. The black, red, green, magenda and aqua points are for 100, 300, 500, 700 and 900 m respectively.
You can see the points fluctuate above for 700 m. (even for 500 m.) This will validate to use a smooth function.
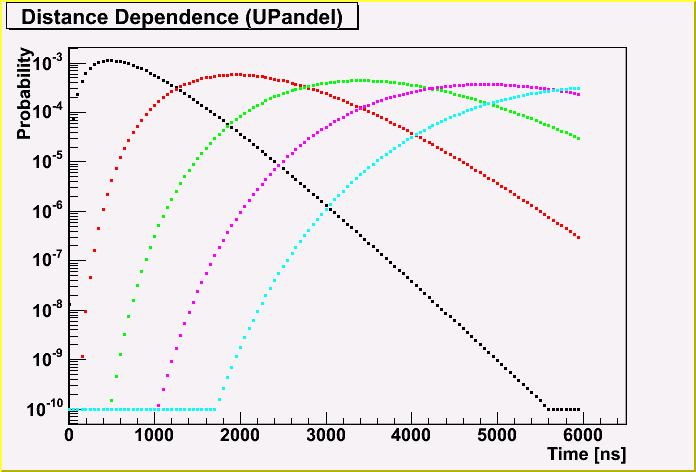
This is for the UPandel function.
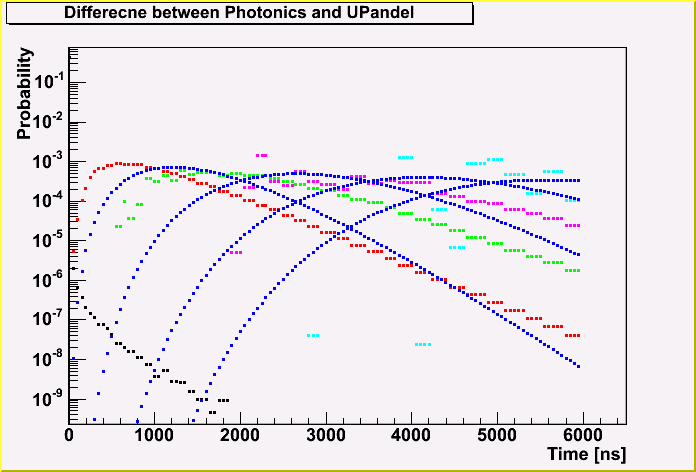
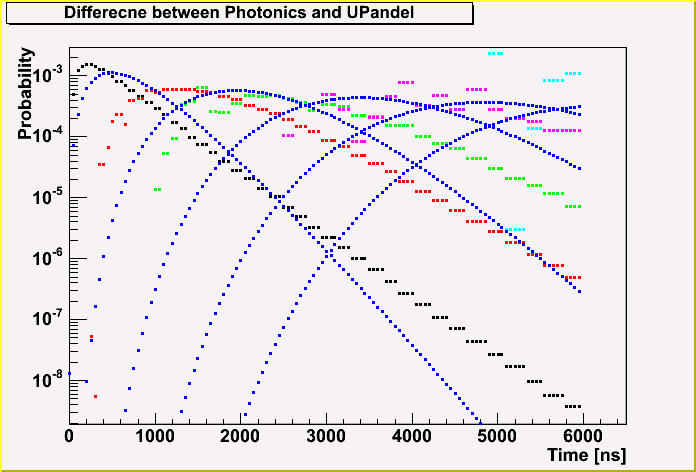
The next 2 plots shows the difference between the Photonics and UPandel function, depending on the distance.
The blue points are of the UPandel function, and the color points are of Photonics. The distance is 0, 200, 400, 600 and 800 m for the first plot, and 100, 300, 500, 700 and 900 m for the second plot. (Note that the distance of 0 m for the UPandel is not correcly calculated and is not shown here.)
We can see the clear difference between the Photonics and the UPandel function.
Since the agreement is not enough for the time probability, I tried to parameterize the Photonics table, and got the new function.
I fitted the Photonics distribution with a function of a0*t^a1*exp(-a2*t) for each distance.
The parameter of a0, a1 and a2 also depends on the distance, so I tried to get the distance dependence.
The parameter is got as below;
I plotted the Photonics distributions with the derived new functions. (The notation is the same as before.)
I would say that the agreement is quite OK. Apparently, better than the UPandel function. Although, the distribution for 0 m is not well expressed by the derived function. I may try to improve it.