The first look of the 22 strings data

I give you results from my first look of the 22 strings data.
I used data of run #10894 which is taken 1st, August, 2007 (PFFilt_PhysicsTrig_PhysicsFiltering_Run00108984_Level0_Part00000000.i3).
I used a script that was used for the 9 strings analysis.
(Thanks to Aya, providing me the script.)
Summary
Let me summarize at first.
Data seems to be mostly fine as far as I checked;) I will investigate the data in more detail.
1. Fundamental plots
|
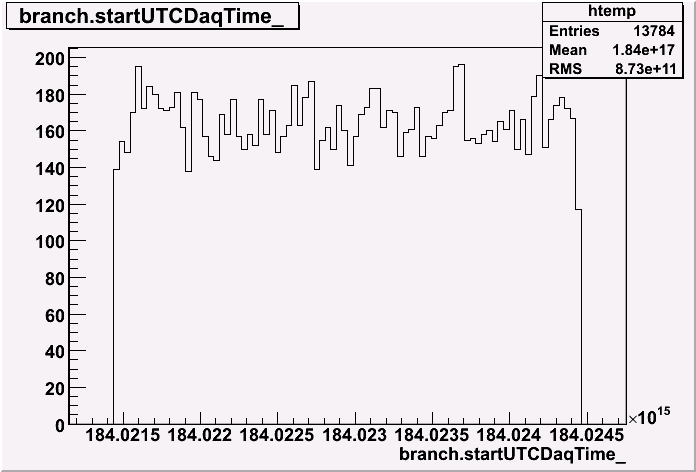
start time. In total, 3000 s = 50 min.
|
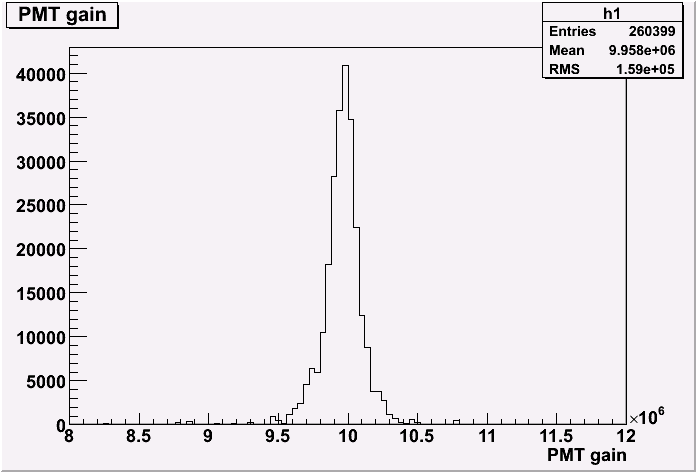
PMT gain distribution. Looks nice.
|
2. First guess
|
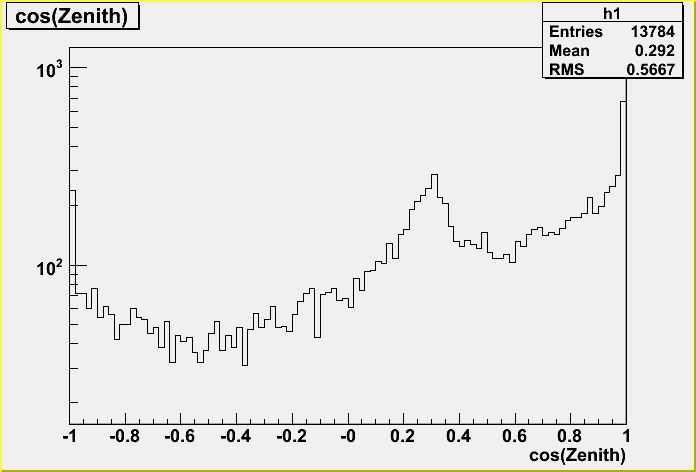
cos(Zenith). There is a peak around 0.3.
|
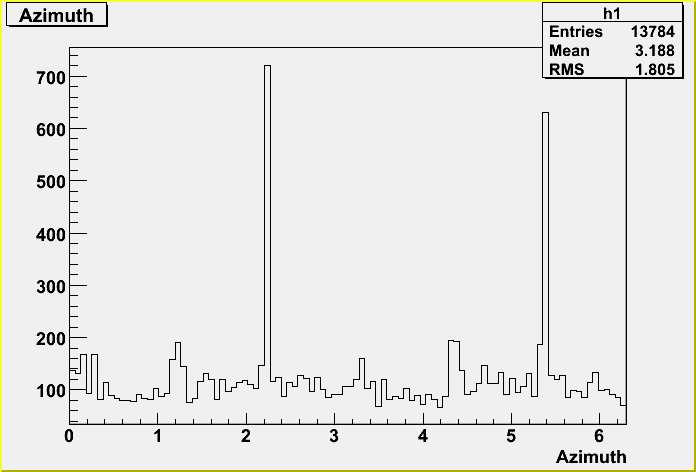
Azimuthal angle. Threre is two peaks.
|
|
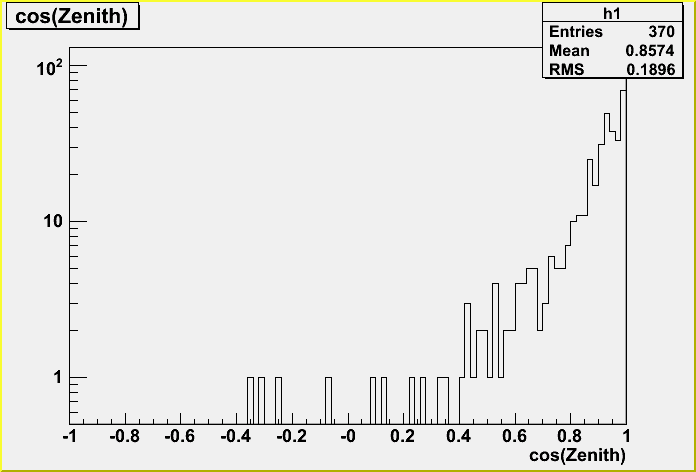
cos(Zenith) with #DOM>80 cut. The peak disappeared.
|
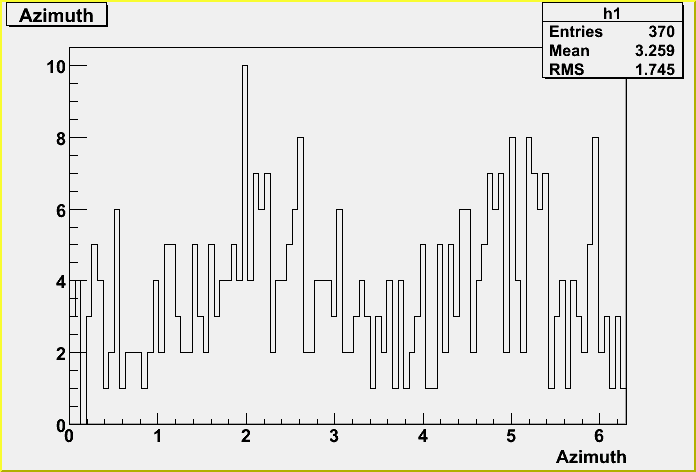
Azimuthal angle with #DOM>80 cut. The peak disappeared, though we need more statistics.
|
|
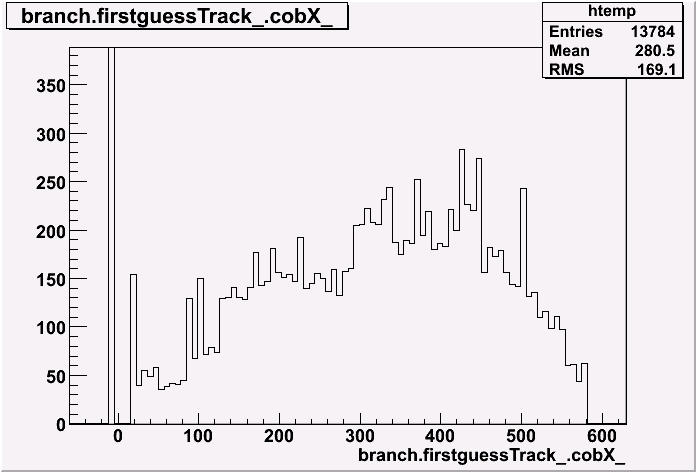
X position of the brightest cascades. There is a peak at 0,
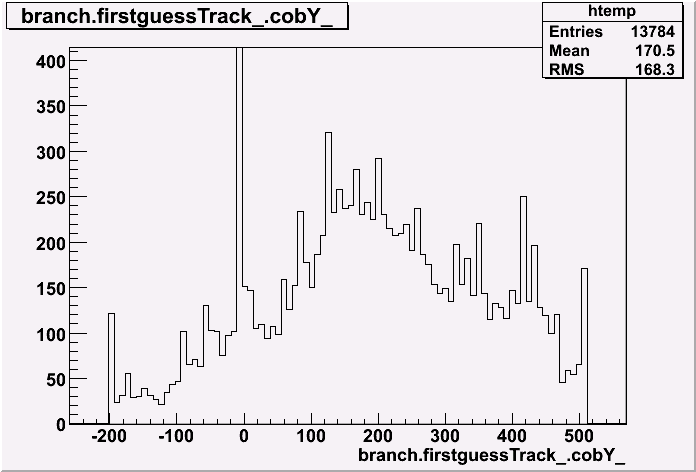
but this is un-physical. This is same for position Y and Z.
|
Y position of the brightest cascades
|
|
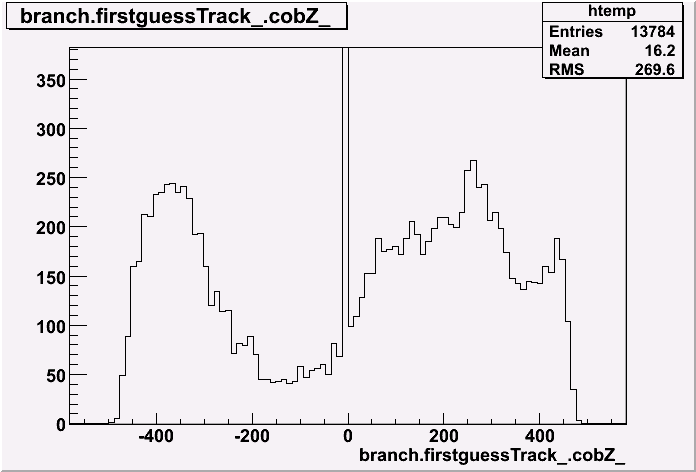
Z position of the brightest cascades. The distribution is reflecting the dust layer.
|
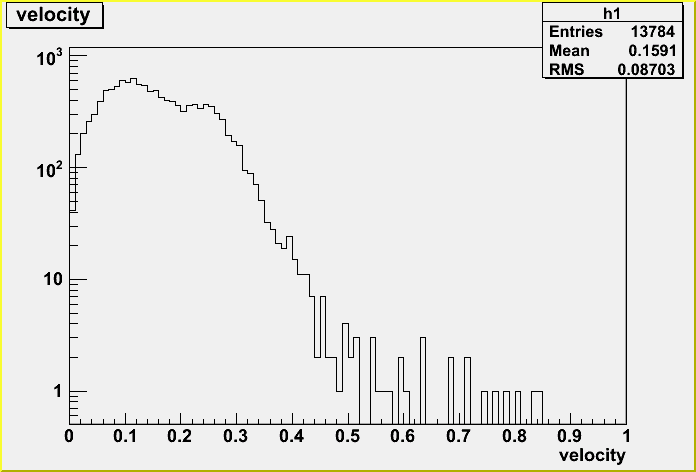
velocity of tracks
|
3. Event base
|
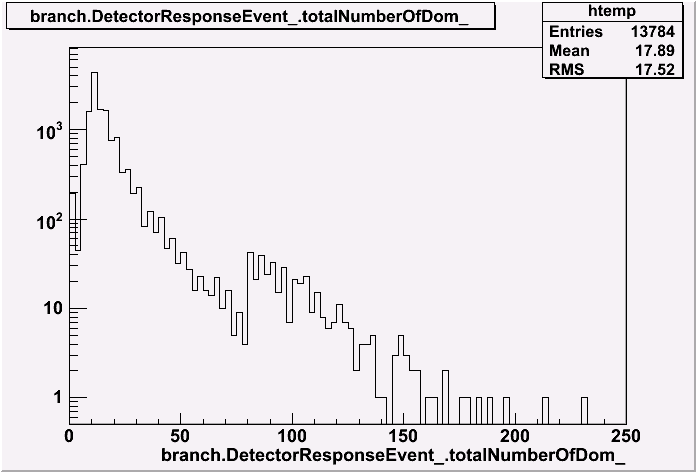
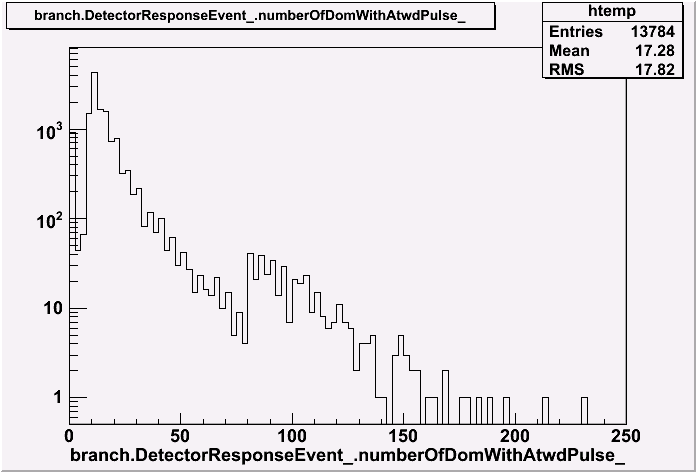
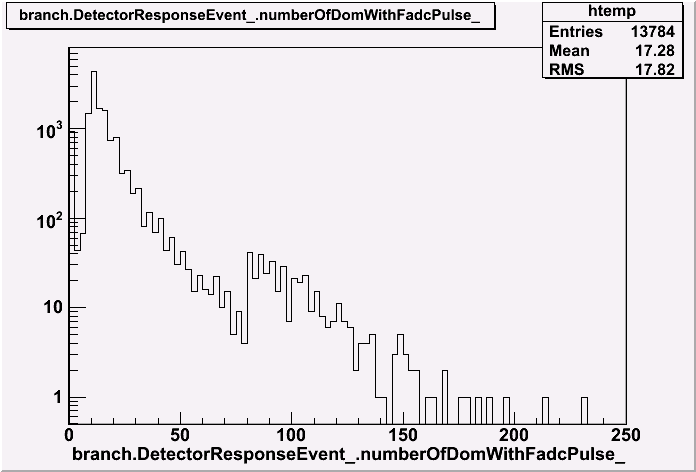
hit DOM distribution. There is a gap at 80 DOMs. I think this is due to different trigger condition.
|
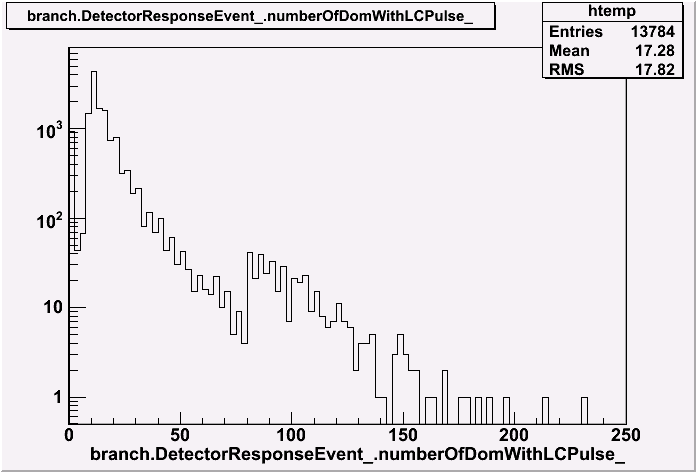
LC triggered DOM distribution
|
|
ATWD hit DOM distribution
|
FADC hit DOM distribution
|
|
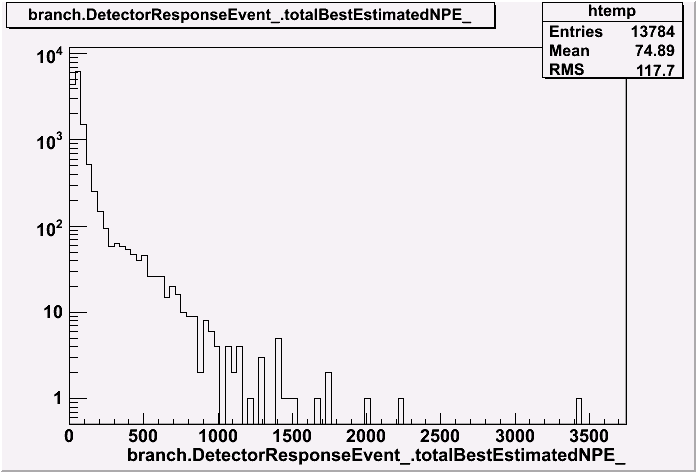
total estimated Npe
|
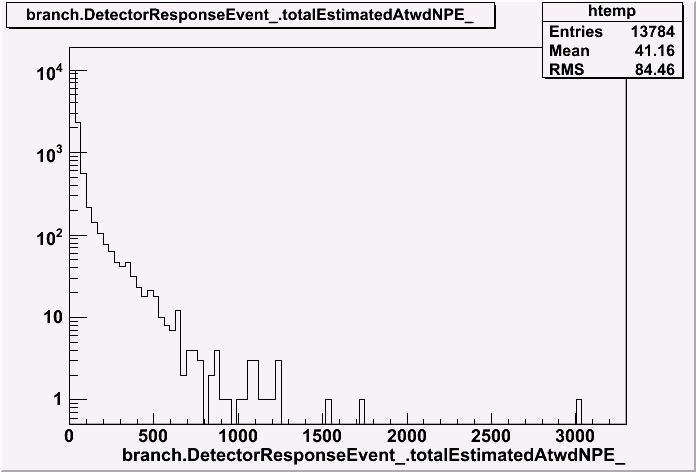
total estimated ATWD Npe
|
|
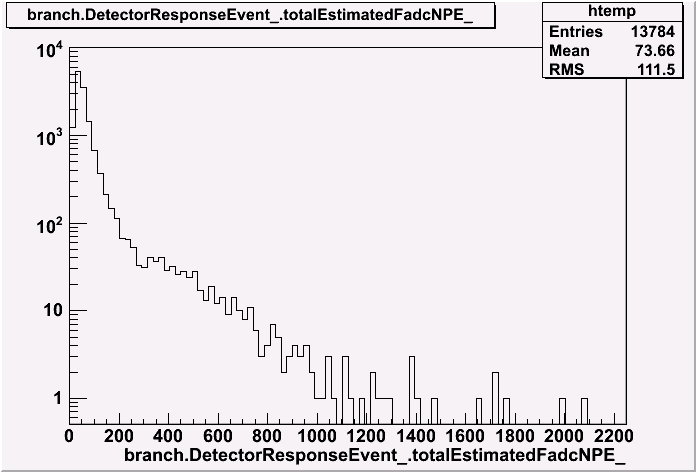
total estimated FADC Npe
|
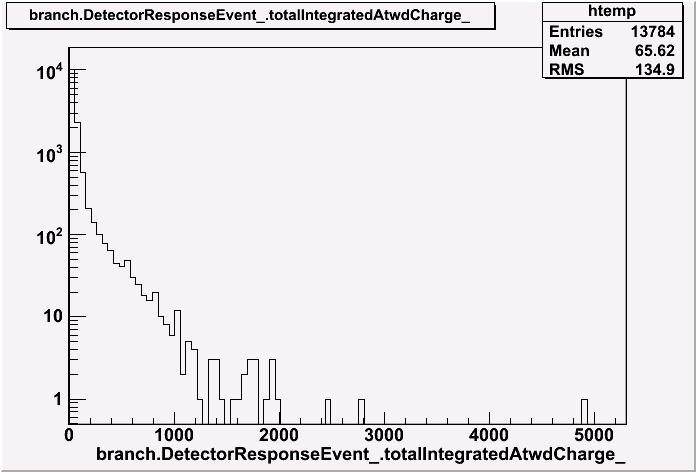
total integrated ATWD charge
|
|
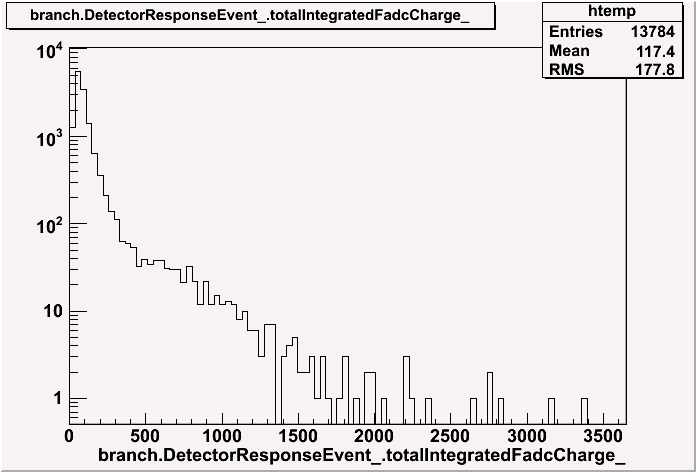
total integrated FADC charge
|
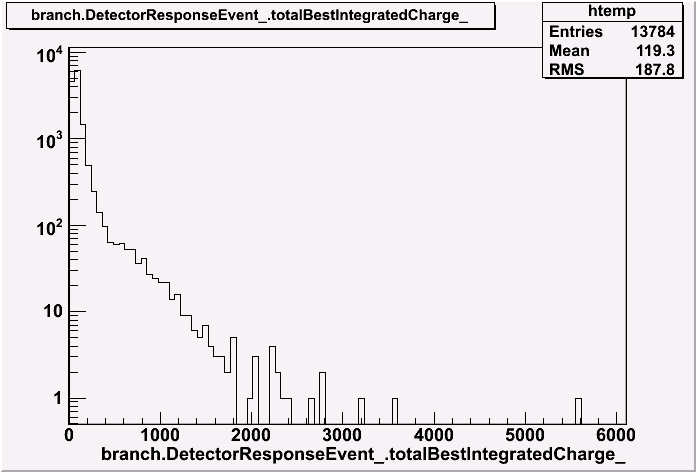
total (based) integrated charge
|
4. ATWD channel base
|
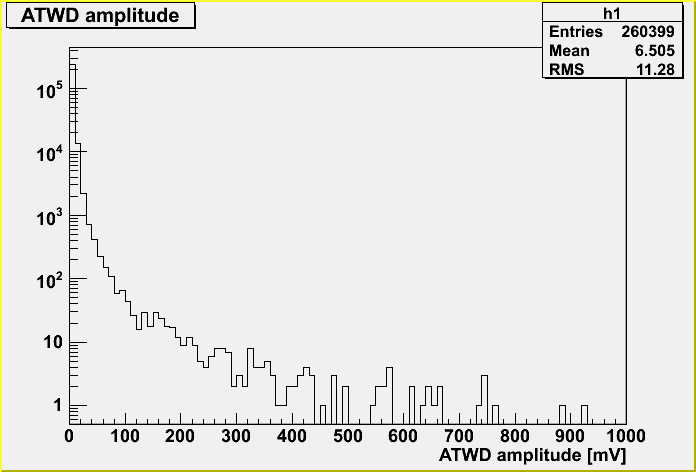
ATWD amplitude distribution
|
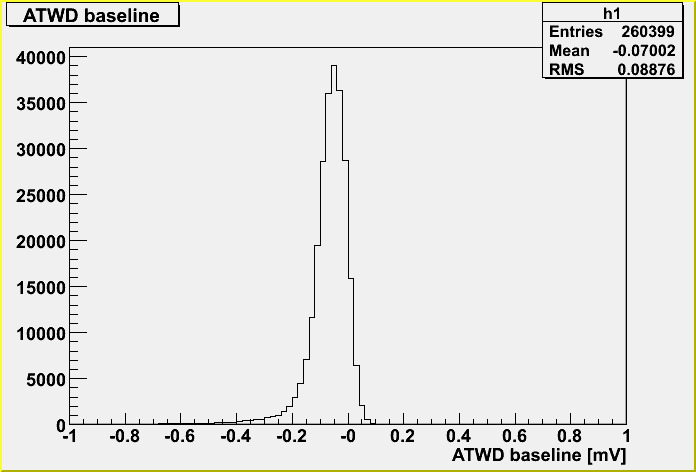
ATWD baseline. looks nice.
|
|
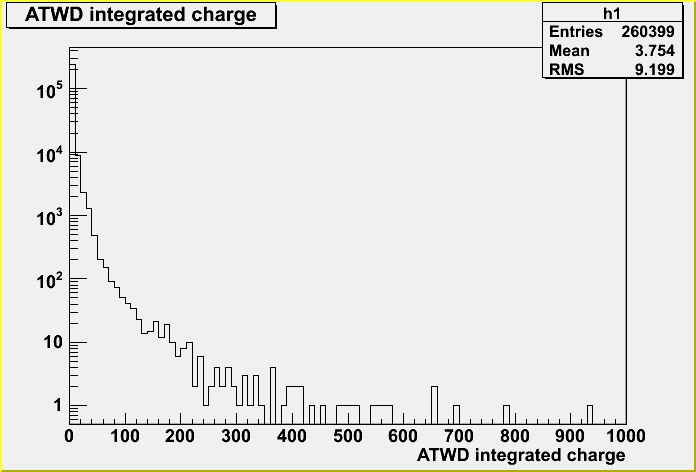
ATWD integrated charge distribution
|
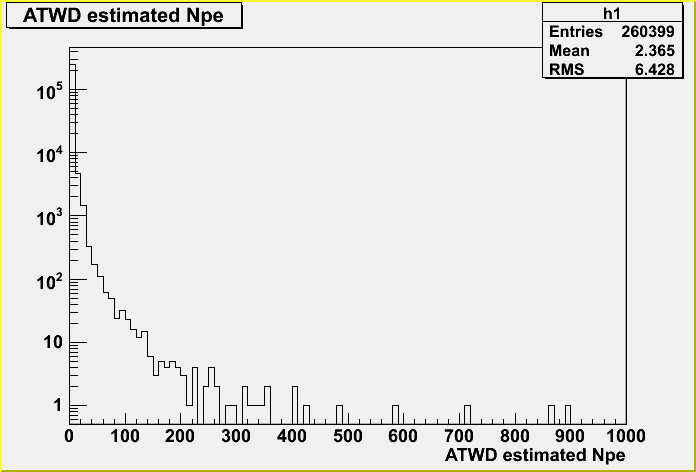
ATWD estimated Npe
|
|
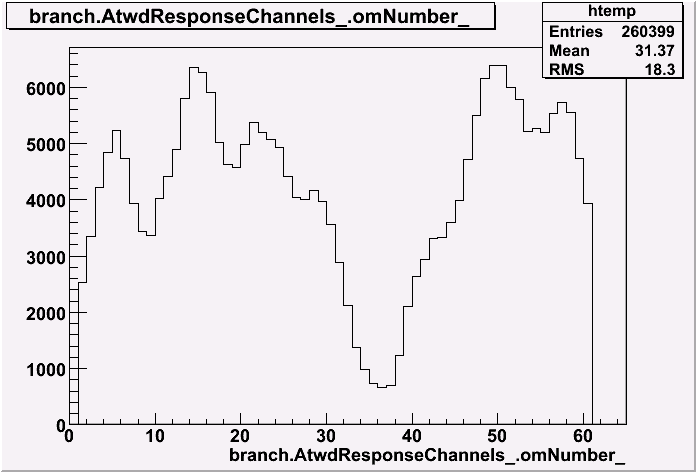
ATWD occupancy vs OM ID
|
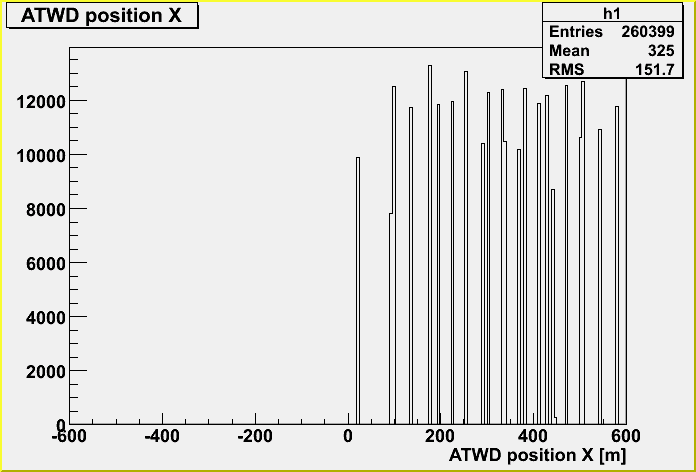
hit position on X axis. uniformly distributed.
|
|
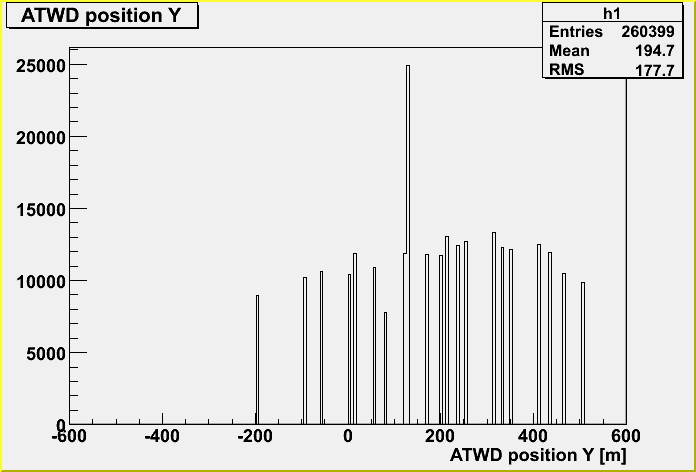
hit position on Y axis. uniformly distributed. The peak is due to just
overlap of strings.
|
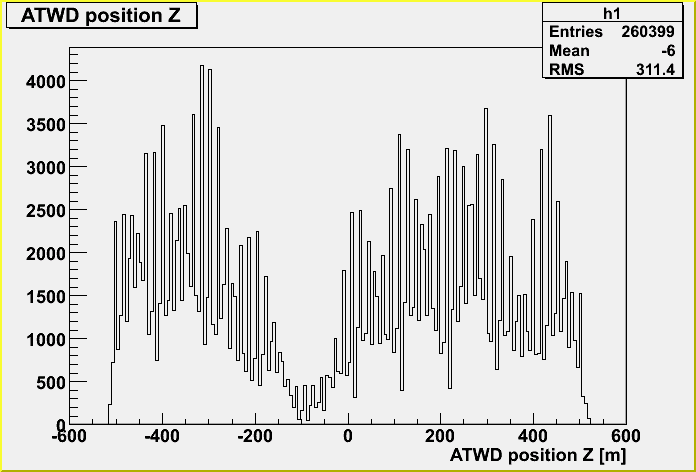
hit position on Z axis. We see again the dust layer effect.
|
5. FADC channel base
Well, these results are more or less same as ATWD ones.
|
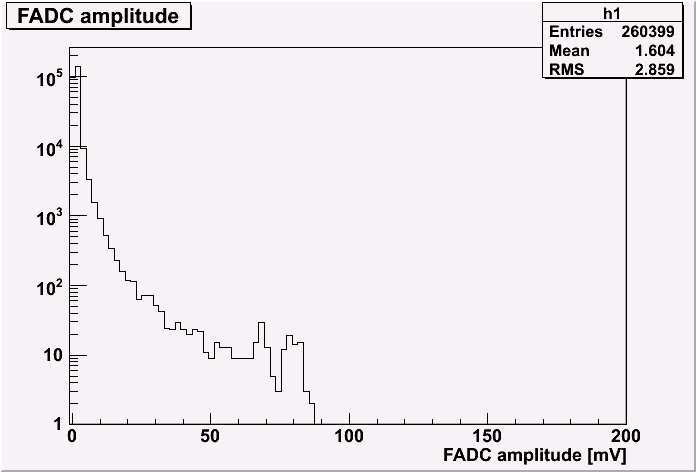
FADC amplitude distribution
|
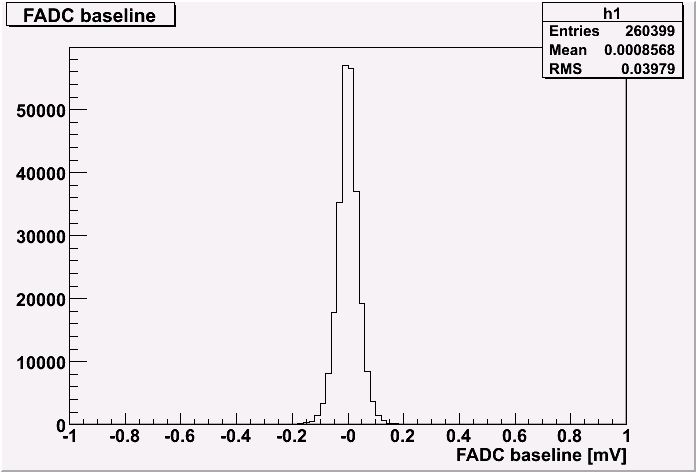
FADC baseline. looks nice.
|
|
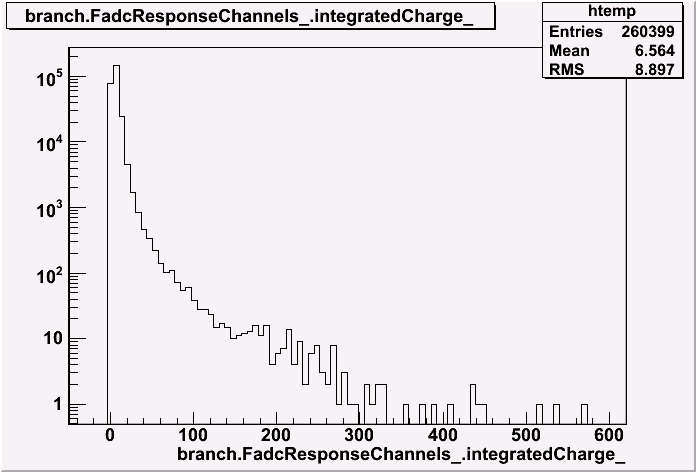
FADC integrated charge distribution
|
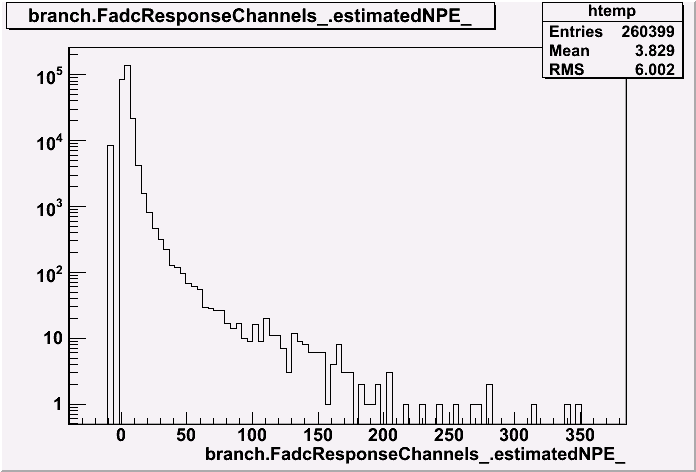
FADC estimated Npe
|
|
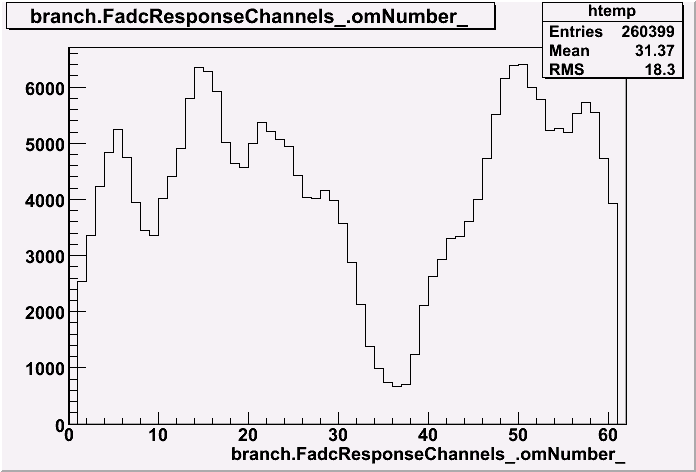
FADC occupancy vs OM ID
|
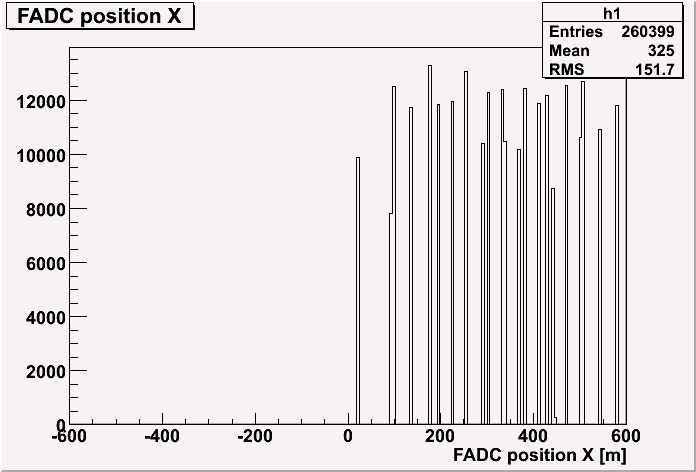
hit position on X axis. uniformly distributed.
|
|
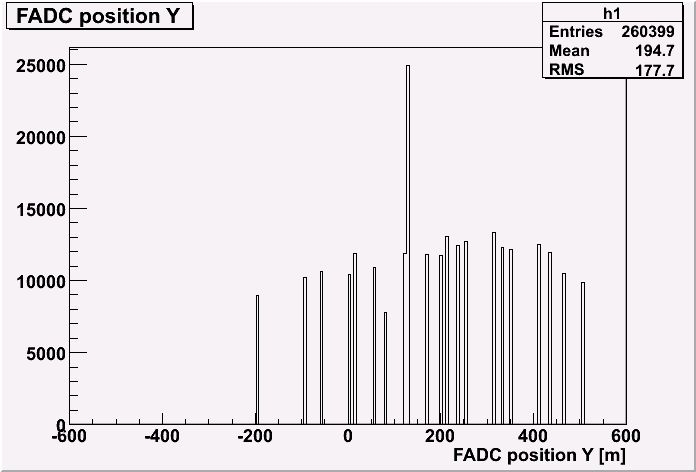
hit position on Y axis. uniformly distributed. The peak is due to just
overlap of strings.
|
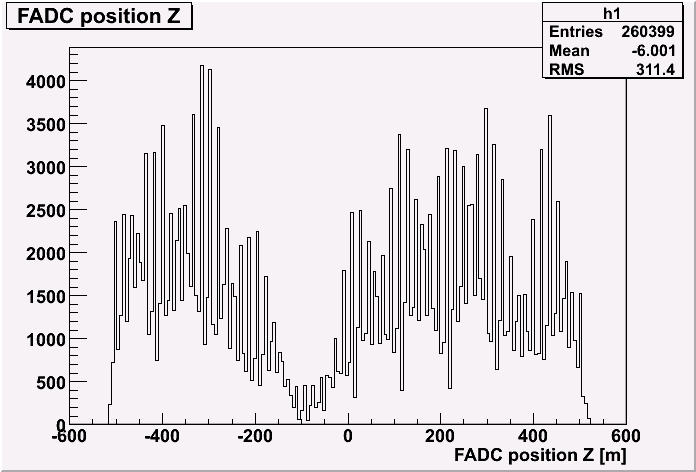
hit position on Z axis. We see again the dust layer effect.
|
Keiichi Mase
Last modified: Mon Aug 20 17:45:19 JST 2007


