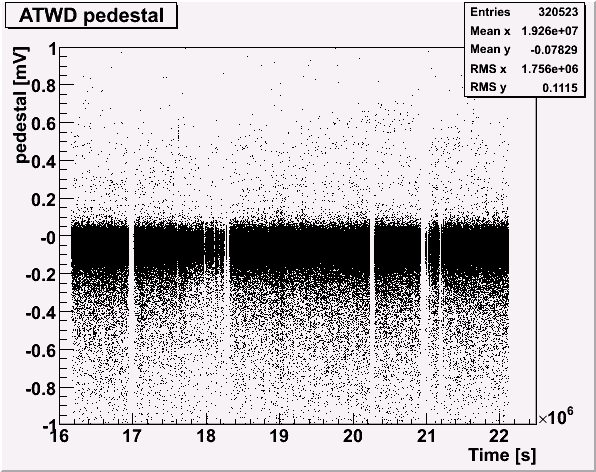
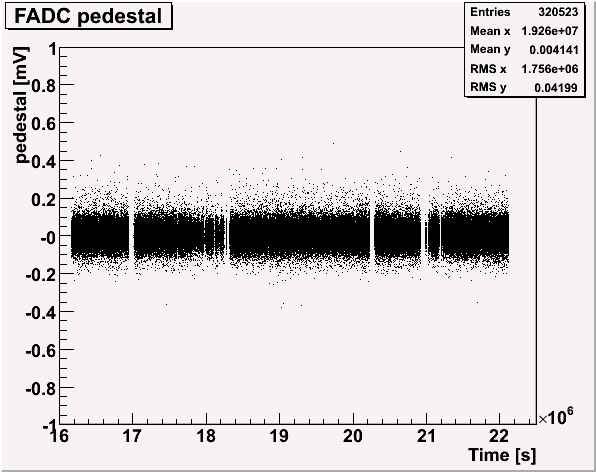
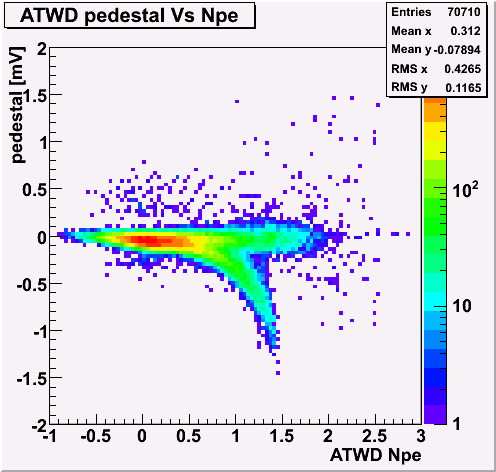
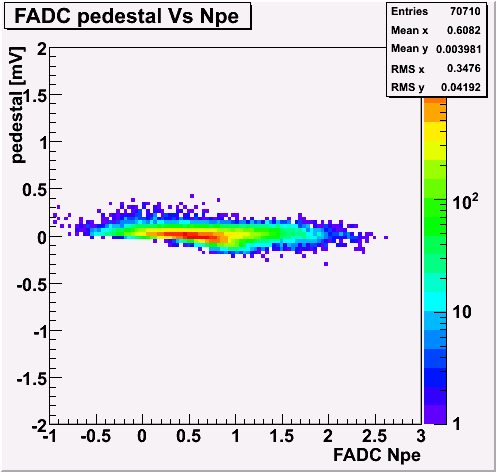
Here, you see results from the 22 strings data.
I used the available data so far(July 7th - Sept. 13th).
The possible signal region is blinded (log10(total Npe)<5.).
The data size is quite large due to the channel-wise information.
I used only 1/10000 events from the available data. (The data are uniformly selected from the whole sample.)
Let me summerize at first. The data generaly looks fine.
|
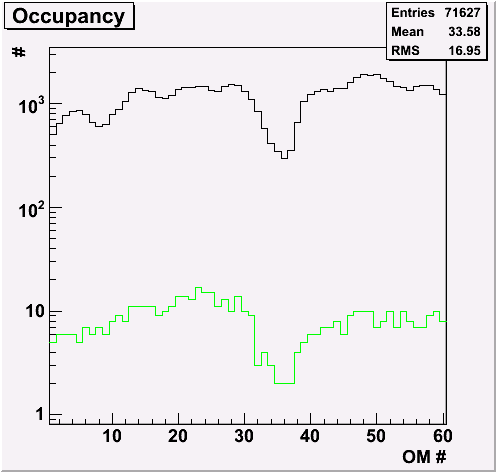
Occupancy (ATWD)
black: no cut
green: log10(total Npe) > 3.5
|
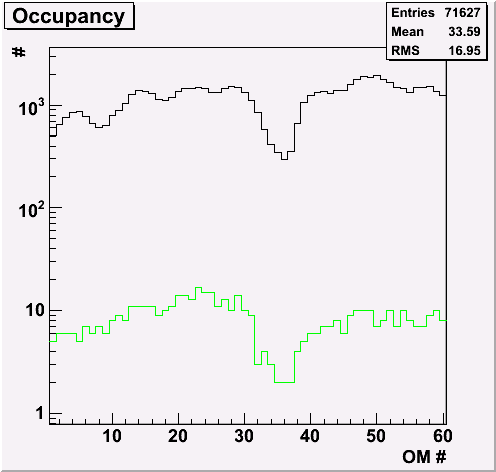
Occupancy (FADC)
black: no cut
green: log10(total Npe) > 3.5
|
|
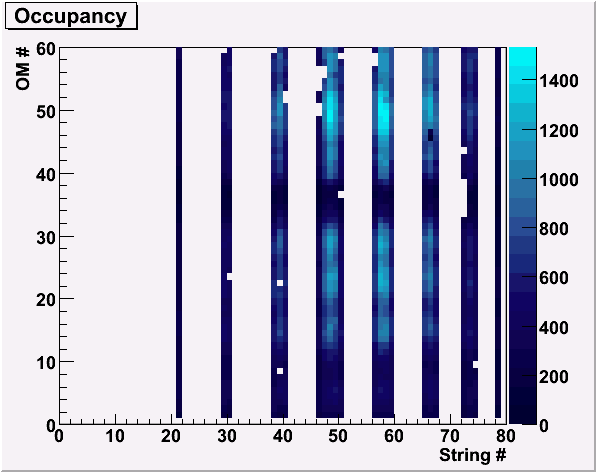
Occupancy (ATWD) for each OM
|
Occupancy (FADC) for each OM
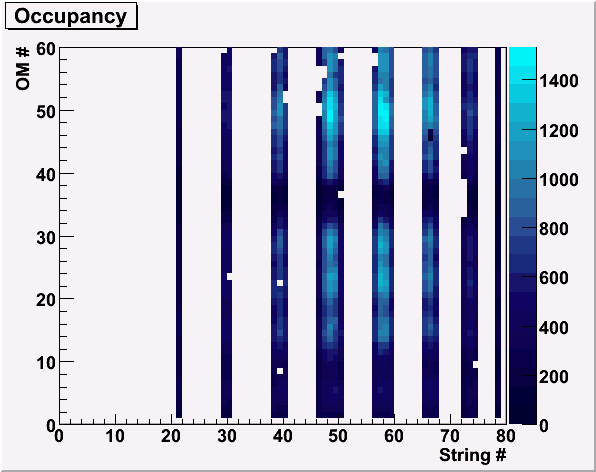
|
|
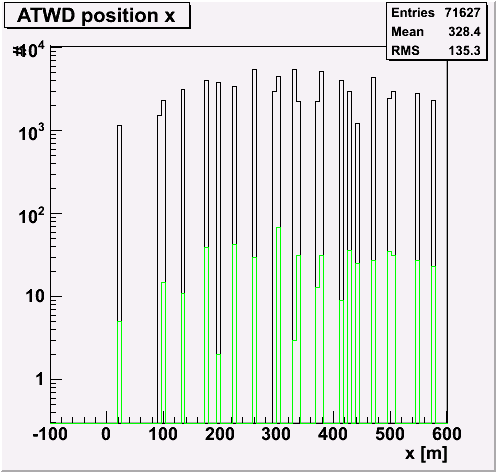
Occupancy (ATWD) Vs x position
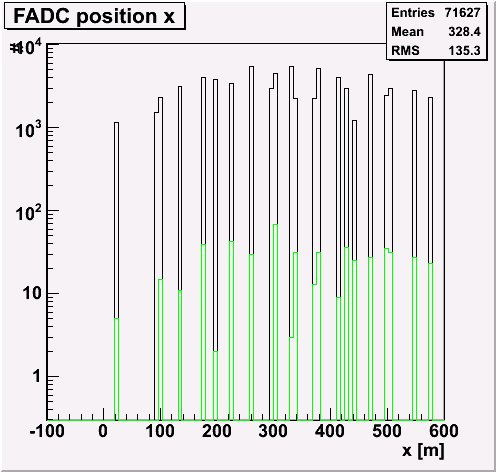
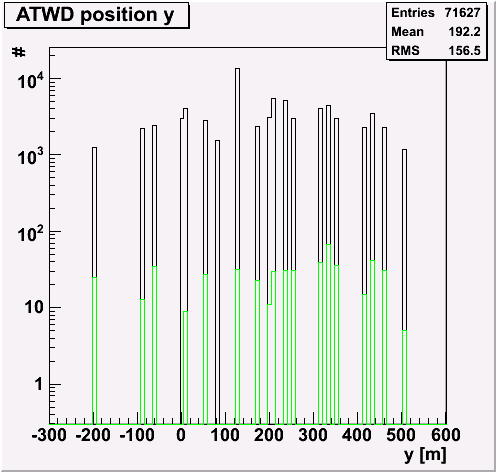
black: no cut
green: log10(total Npe) > 3.5
|
Occupancy (FADC) Vs x position
|
|
Occupancy (ATWD) Vs y position
|
Occupancy (FADC) Vs y position
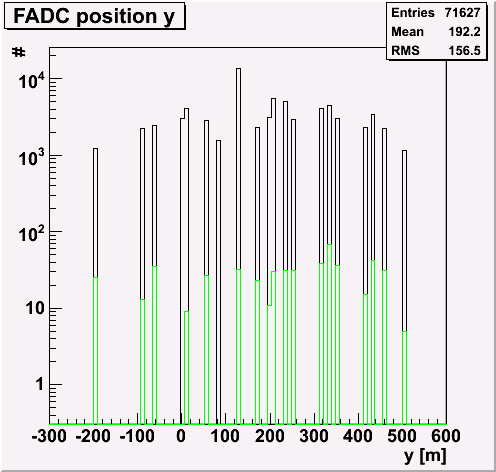
|
|
Occupancy (ATWD) Vs z position
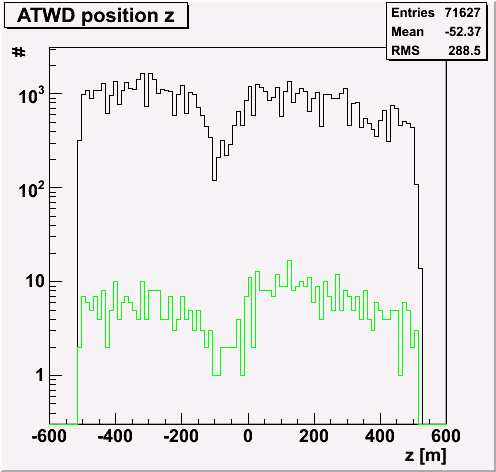
|
Occupancy (FADC) Vs z position
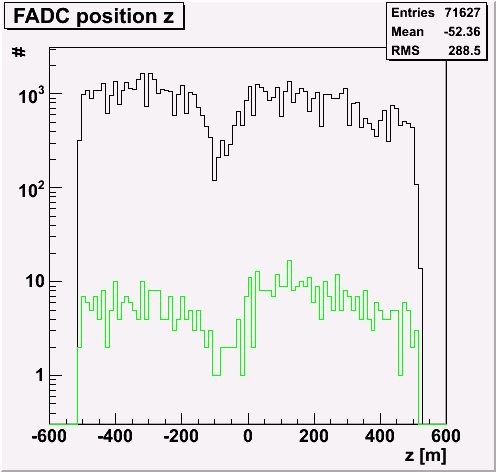
|
|
Occupancy (ATWD) Vs xy position
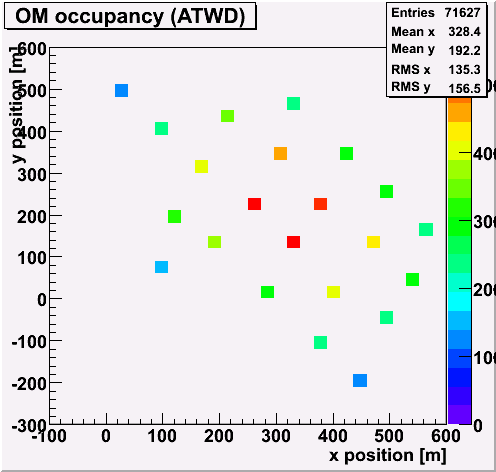
|
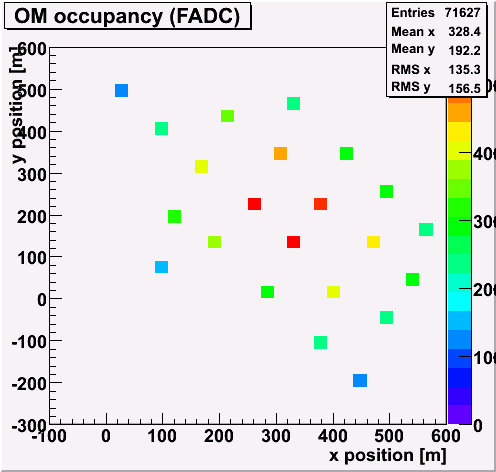
Occupancy (FADC) Vs xy position
|
|
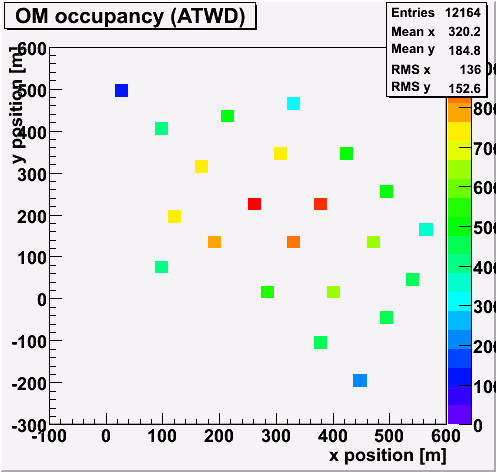
Occupancy (ATWD) Vs xy position (log10(Npe)>3)
|
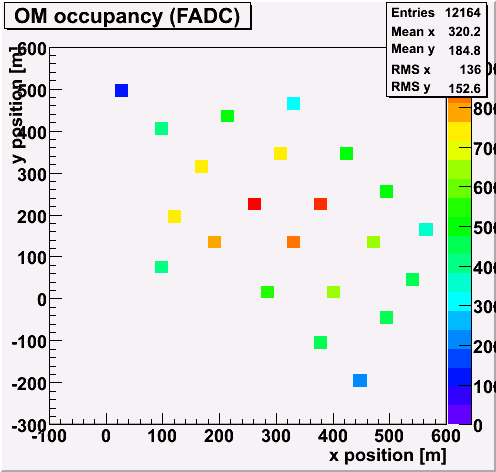
Occupancy (FADC) Vs xy position (log10(Npe)>3)
|
|
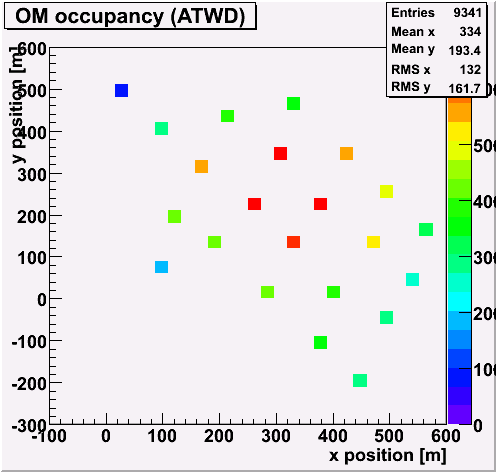
Occupancy (ATWD) Vs xy position (log10(Npe)>3.5)
|
Occupancy (FADC) Vs xy position (log10(Npe)>3.5)
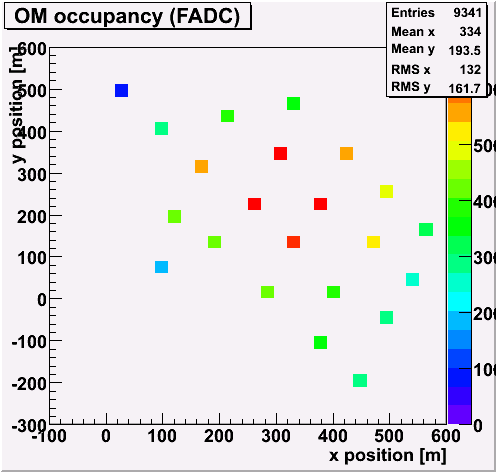
|
|
Occupancy (ATWD) Vs xz position
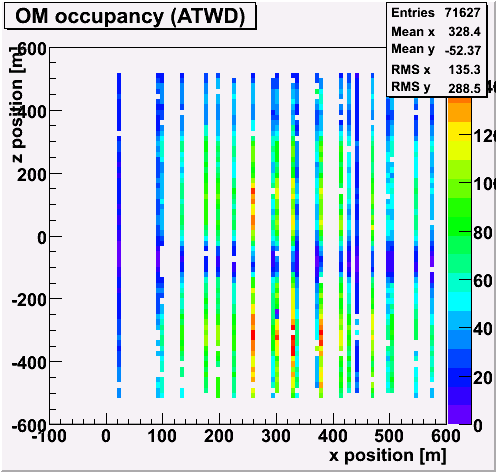
|
Occupancy (FADC) Vs xz position
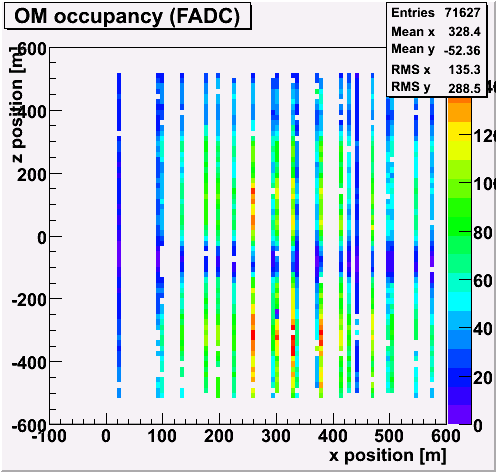
|
|
Occupancy (ATWD) Vs xz position (log10(Npe)>3)
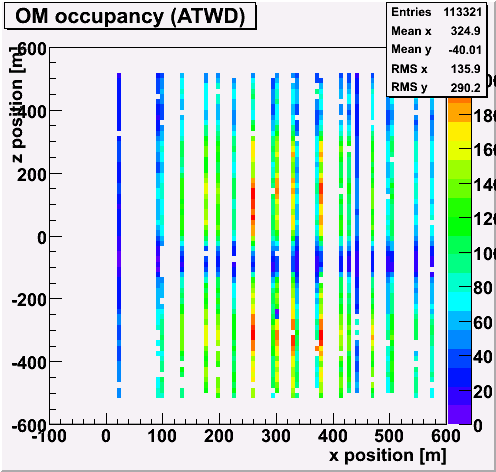
|
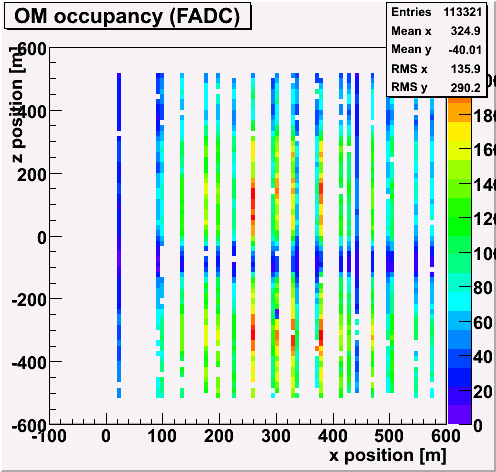
Occupancy (FADC) Vs xz position (log10(Npe)>3)
|
|
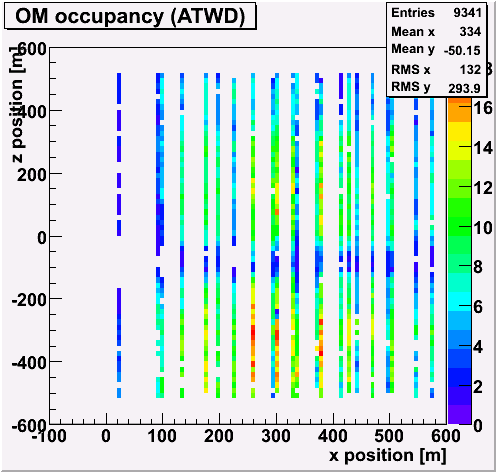
Occupancy (ATWD) Vs xz position (log10(Npe)>3.5)
|
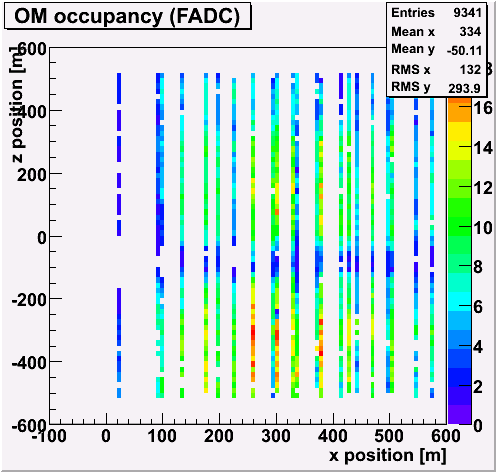
Occupancy (FADC) Vs xz position (log10(Npe)>3.5)
|
|
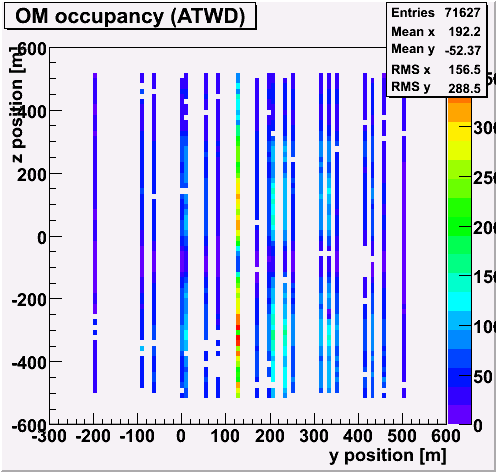
Occupancy (ATWD) Vs yz position
|
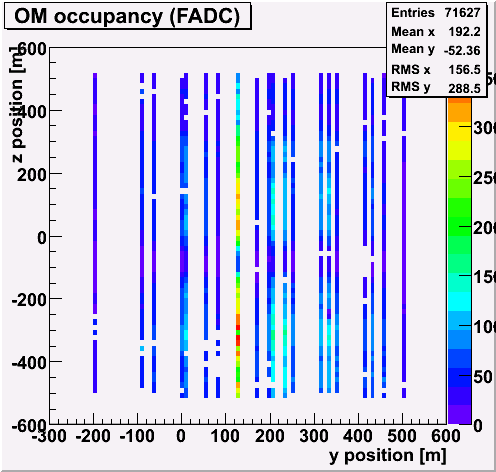
Occupancy (FADC) Vs yz position
|
|
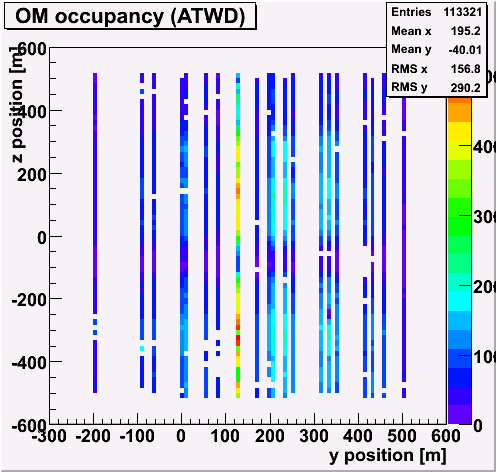
Occupancy (ATWD) Vs yz position (log10(Npe)>3)
|
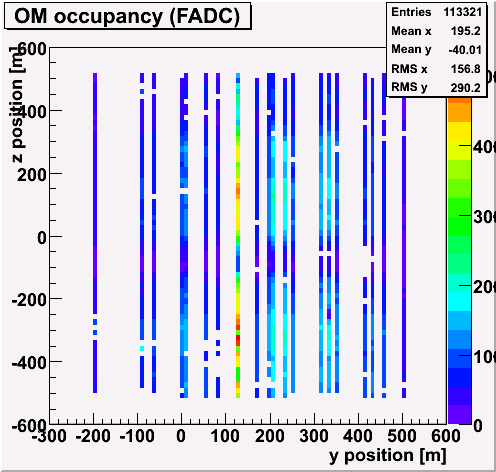
Occupancy (FADC) Vs yz position (log10(Npe)>3)
|
|
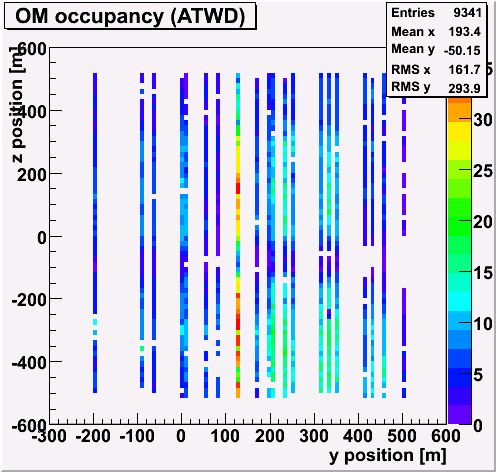
Occupancy (ATWD) Vs yz position (log10(Npe)>3.5)
|
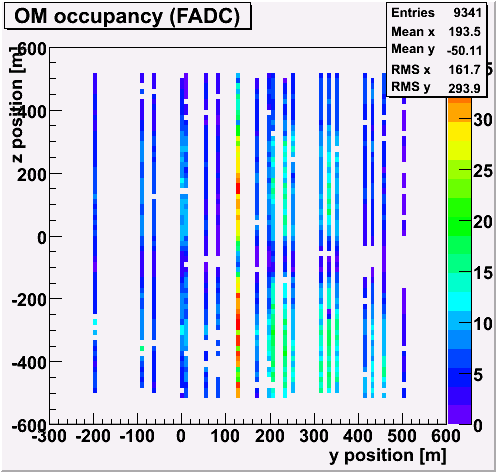
Occupancy (FADC) Vs yz position (log10(Npe)>3.5)
|
|
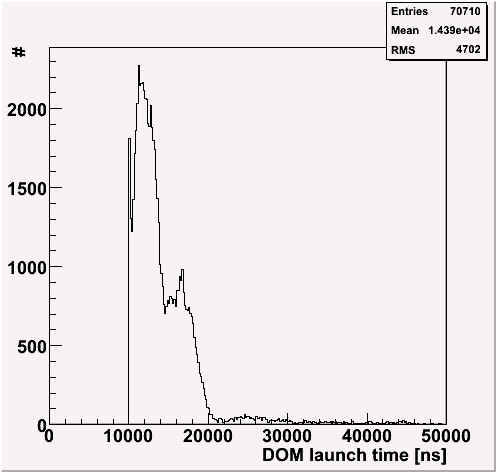
DOM launch time
There seem to be three peaks. (11000, 17000 and 25000 [ns])
I checked more, so please go to this page if you are interested.
|
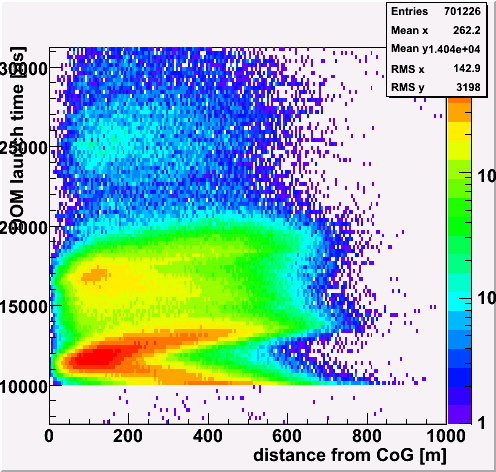
Launch time Vs distance from the CoG
There are some correlation between the launch time and the CoG.
|
|
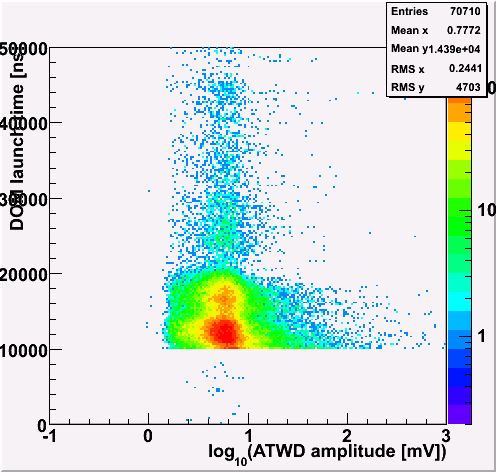
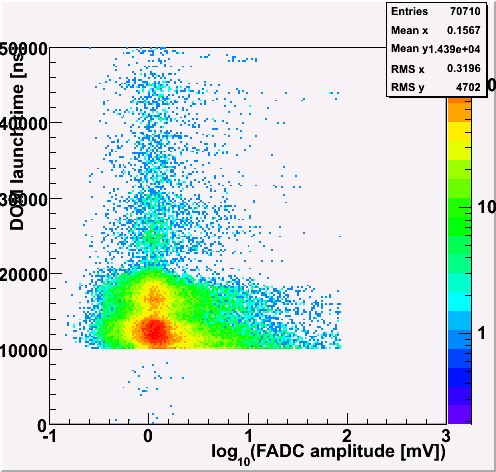
Launch time Vs amplitude (ATWD)
There is no clear amplitude dependence.
|
Launch time Vs amplitude (FADC)
|
|
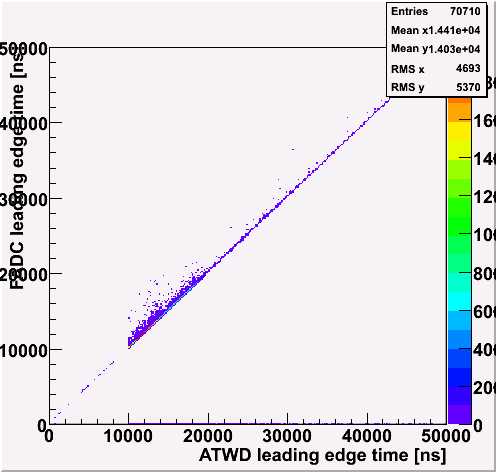
FADC leading edge time Vs ATWD leading edge time
The leading time is defined the timming when above 3 mV.
|
|
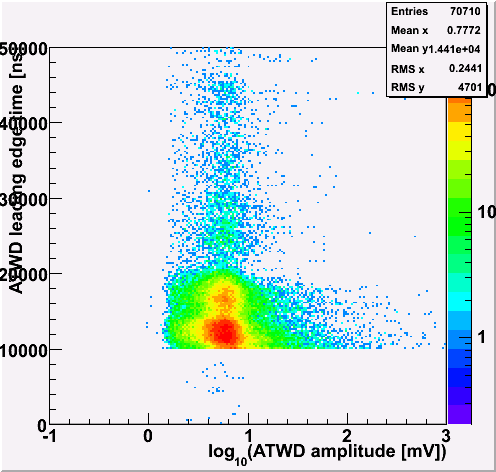
Leading edge time Vs amplitude (ATWD)
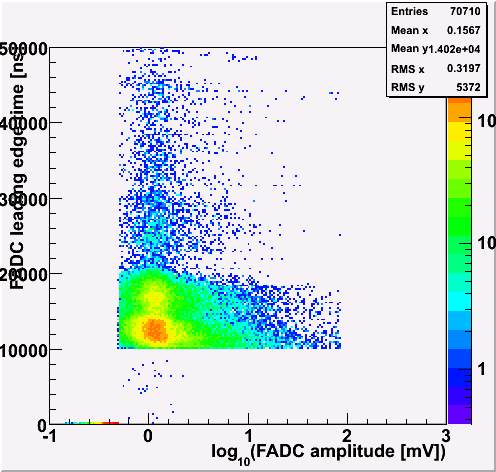
There is no clear amplitude dependence.
|
Leading edge time Vs amplitude (FADC)
|
|
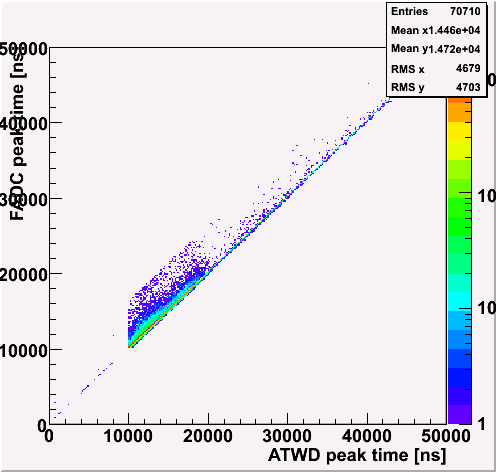
FADC peak time Vs ATWD peak time
|
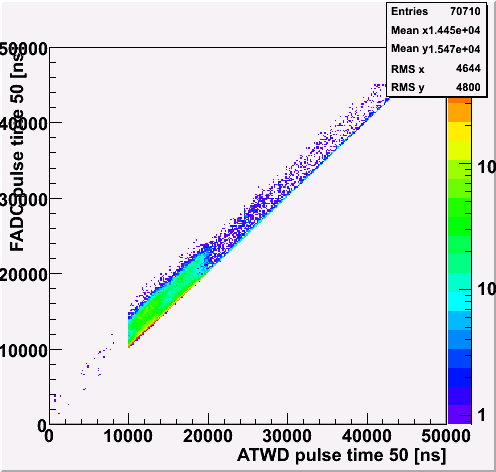
FADC time 50 Vs ATWD time 50.
Time 50 is defined as the time when 50% of total signal included.
You see some spread.
|
|
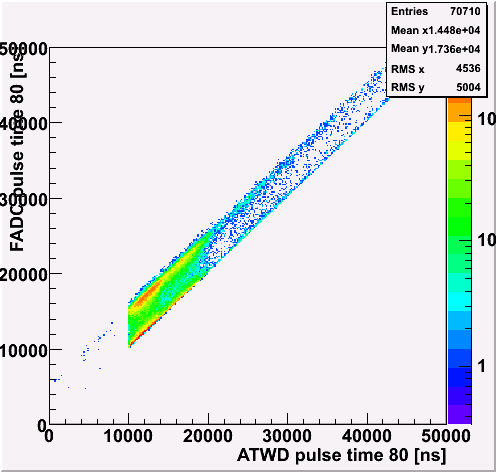
FADC time 80 Vs ATWD time 80.
Time 80 is defined as the time when 80% of total signal included.
Now, two distributions are clearly seen. The difference is about 5 micro second. Interesting...
|
|
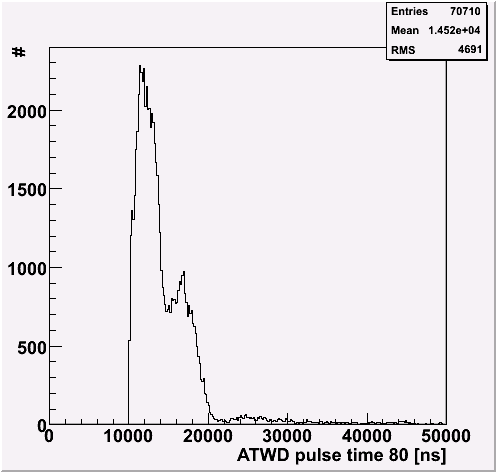
ATWD time 80
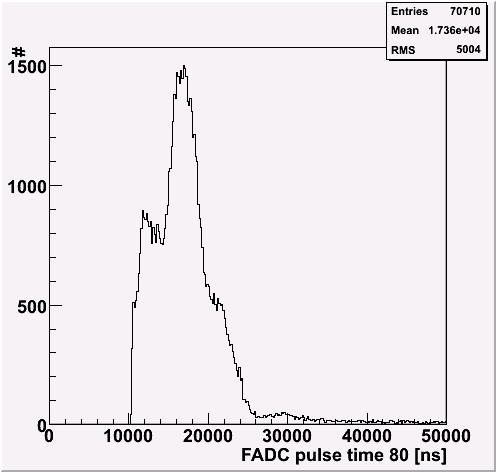
The peak time is different between ATWD and FADC. This is the reason of the two branches in above plot.
|
FADC time 80
|
|
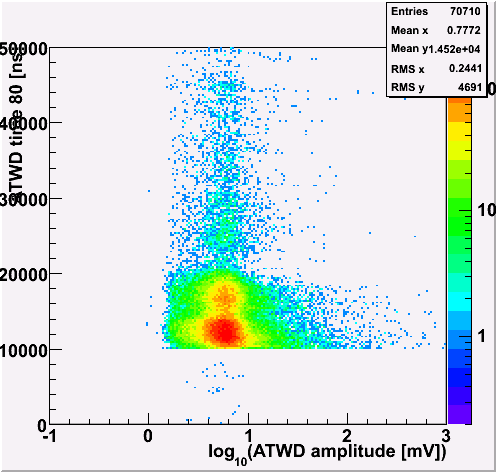
Time 80 Vs amplitude (ATWD)
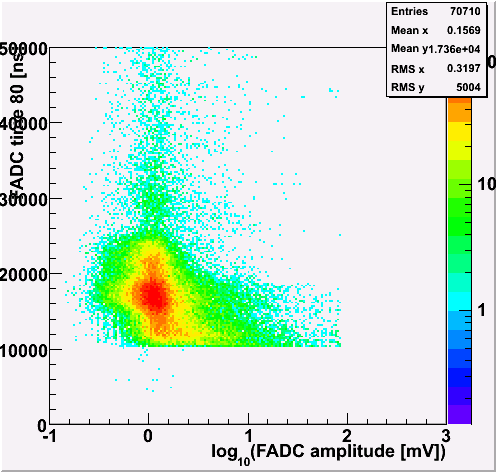
No clear correlation.
|
Time 80 Vs amplitude (FADC)
|
