Comparison between juliet and corsika MC samples

Introduction
In order to check a contribution from tracks, I checked several values such as the total energy loss by separating contributions both of cascades and tracks.
I used three sets of data. One is standard juliet MC, second one is corsika files generated by myself, and the final set is the corsika files generated by Henrike. The difference of the corsika files between mine and Henrike's is mainly the threshold energy for muon tracks at the generation. The threshold energy for the muon generation is 273 GeV for Henrike's and 1 TeV for mine, so in the Henrike's sample, there are more muon tracks.
Because I realized that in Henrike's sample the zenith angle is only up to 10 deg., so I also put the similar condition for other samples, namely ZA < 30 deg. The distance distribution is also a bit different, so the dist < 600m is also applied to all samples.
Energy loss for a track
At first energy loss for a track is examined.
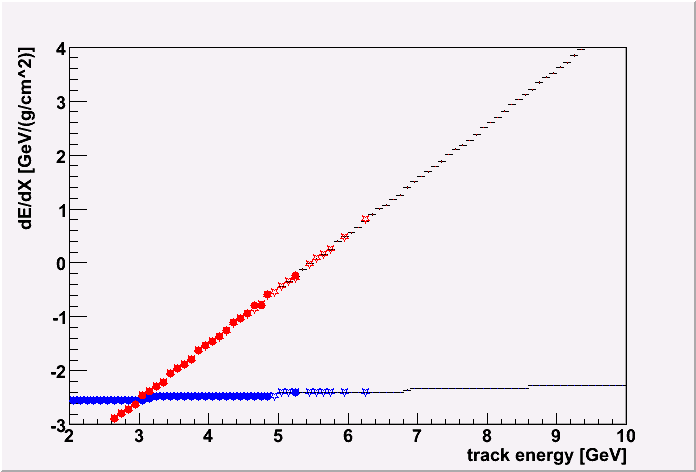
In the left plot below, I plotted dE/dX for the radiative process (pair creation + photo-nuclear interaction + brems.) (red) and ionization loss (blue) by applying
dE/dX table (used in mmc) for simulated tracks.
The result is simply as same as the table, and the realtion is expressed as below.
log10(dE/dX [GeV/(g/cm^2)]) = -5.60 + 1.01*log10(track energy [GeV])
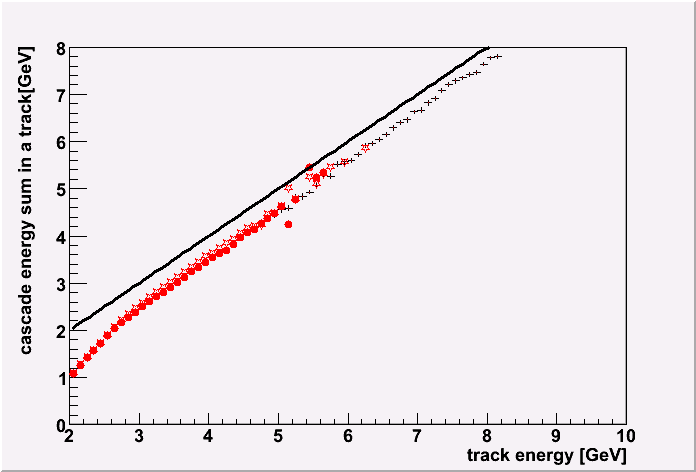
On the right plot below, sum of the cascade energy for a track is plotted.
All three MC datasets agrees with each other. There are steep fall off at
around 10^3 GeV. This is because a track looses its energy by ionization loss,
leaing to the less cascade output.
Because of this steep fall off, the total cascade energy doesn't nearly change
when I applied to 1 TeV muon generation threshold. See below.
|
Theoritical energy loss Vs track energy
red: pair creation + photo-nuclear + brems.,
blue: ionization loss
line: juliet, star: corsika, circle: corsika(Henrike)
|
Sum of cascade energy from a track Vs the track energy
red: cascade, blue: track
line: juliet, star: corsika, circle: corsika(Henrike)
|
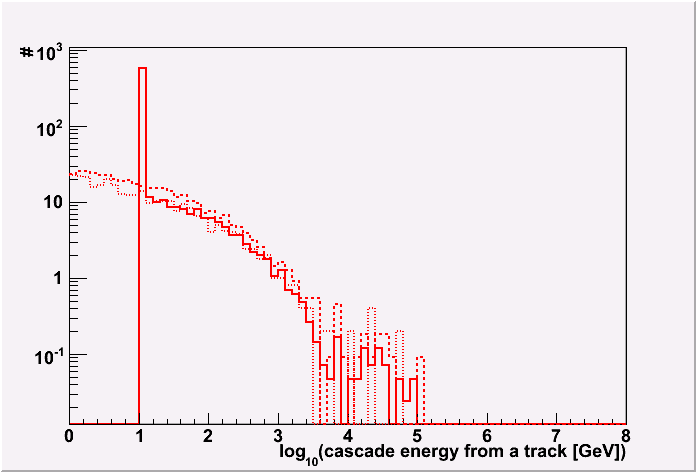
The cascade energy distribution for a track (10^5 GeV) is shown below. All three distributions
for diffrent MC data set are reasonably agrees with each other at 10^5 GeV.
|
Cascade energy distributions from a track (10^5 GeV)
line: juliet, dot: corsika, small dot: corsika(Henrike)
|
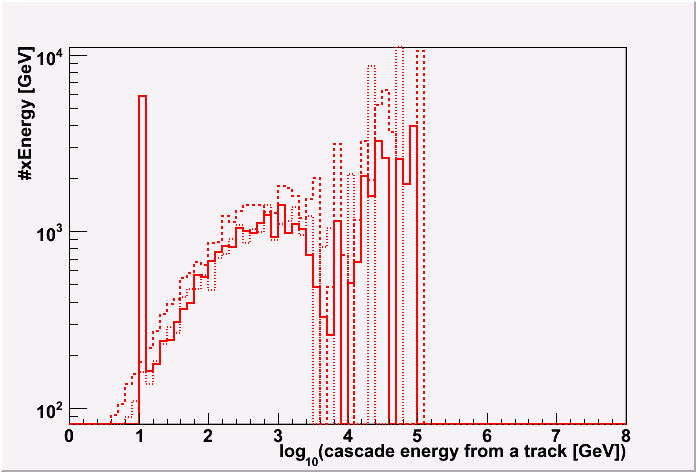
Cascade energy distributions from a track (10^5 GeV) multiplied by the energy
line: juliet, dot: corsika, small dot: corsika(Henrike)
|
Energy loss of a bundle
Then, total energy loss of a bundle is checked.
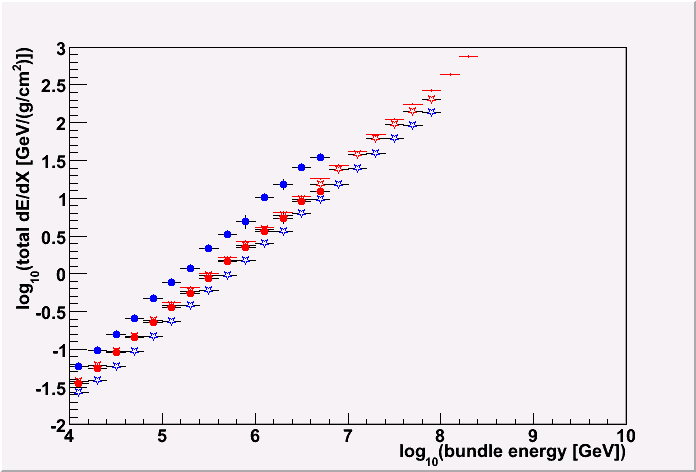
The theoritical dE/dX derived as above is summed up for a bundle both for radiative process and the ionization loss. This is shown in the left plot below.
As seen, the energy loss by radiative process is same for three MC datasets, even though the track distribution in a bundle is different.
On the other hand, the energy loss by ionization loss is more than that by radiative process in case of Henrike's dataset because it contains many tracks.
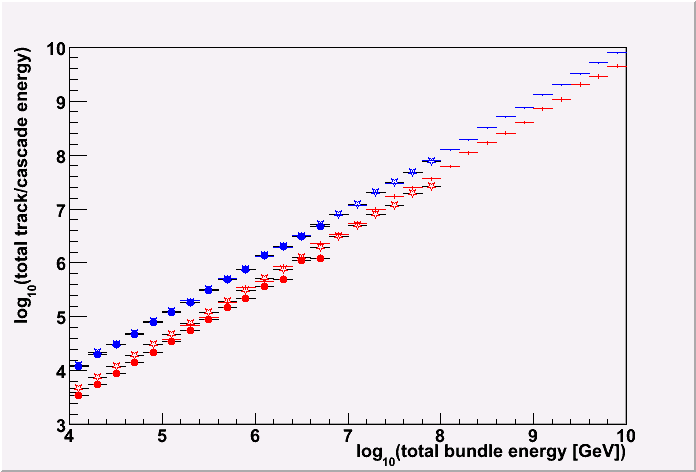
The total cascade energy for a bundle is shown in the right plot below.
The total cascade sum for all three samples roughly agrees, but corsika samples
gives slightly less total cascade energy in a bundle compared to the juliet one,
which I don't understand completely. (There is also a slight difference between
corsika samples, but this is due to a way we define the bundle energy. See below.)
|
Theoritical dE/dX sum for a bundle Vs bundle energy
red: pair creation + photo-nuclear + brems.,
blue: ionization loss
line: juliet, star: corsika, circle: corsika(Henrike)
|
Sum of cascade energy from a bundle Vs the bundle energy
red: cascade, blue: track
line: juliet, star: corsika, circle: corsika(Henrike)
|
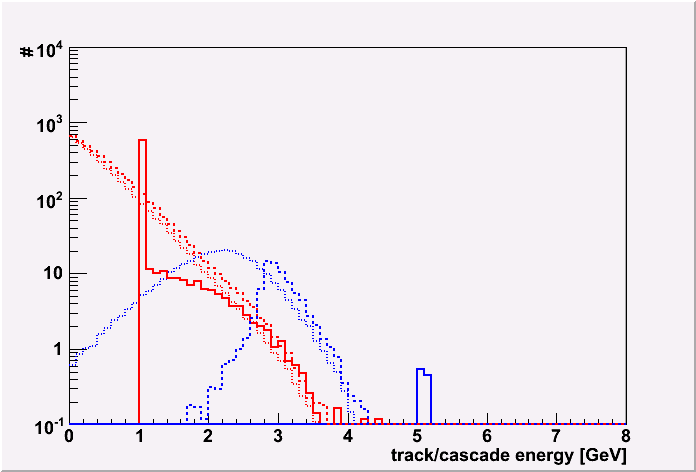
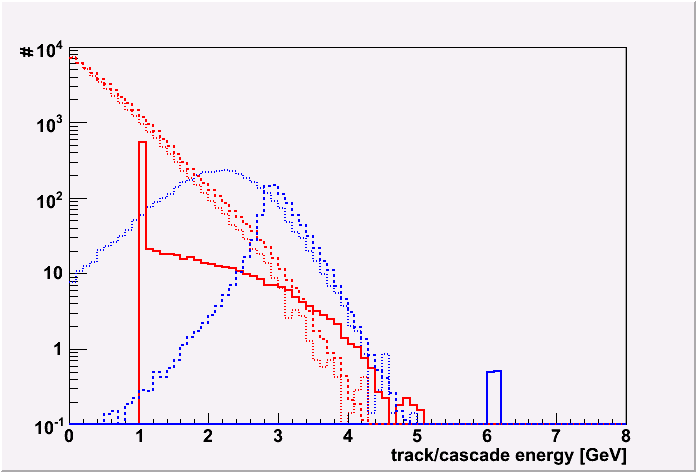
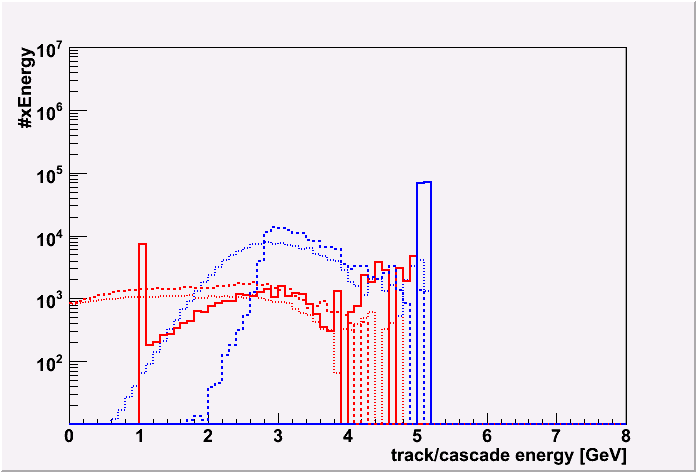
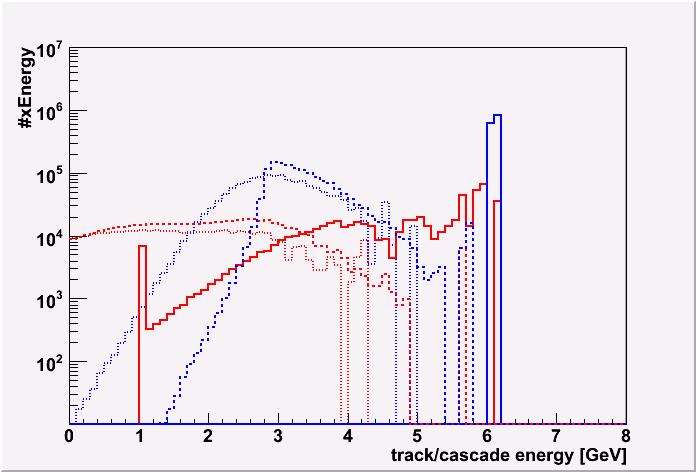
The energy distributions for a bundle with a fixed energy is shown below.
Because the corsika I generated has higher threshold (1 TeV), the distribution is
slightly shifted to right side in order to compensate low enrgy tracks that is ignored.
(So, effectively the cosmic ray primary energy is slightly higher for my samples. See below.)
The distributions of cascades are different between juliet and corsika MC,
though both gives roughly same total cascade energy sum for a bundle.
|
Energy distribution in a bundle of 10^5 GeV
red: cascade, blue: track
line: juliet, dot: corsika, small dot: corsika(Henrike)
|
Energy distribution in a bundle of 10^6 GeV
red: cascade, blue: track
line: juliet, dot: corsika, small dot: corsika(Henrike)
|
I multiplied the energy.
|
Energy distribution in a bundle of 10^5 GeV
red: cascade, blue: track
line: juliet, dot: corsika, small dot: corsika(Henrike)
|
Energy distribution in a bundle of 10^6 GeV
red: cascade, blue: track
line: juliet, dot: corsika, small dot: corsika(Henrike)
|
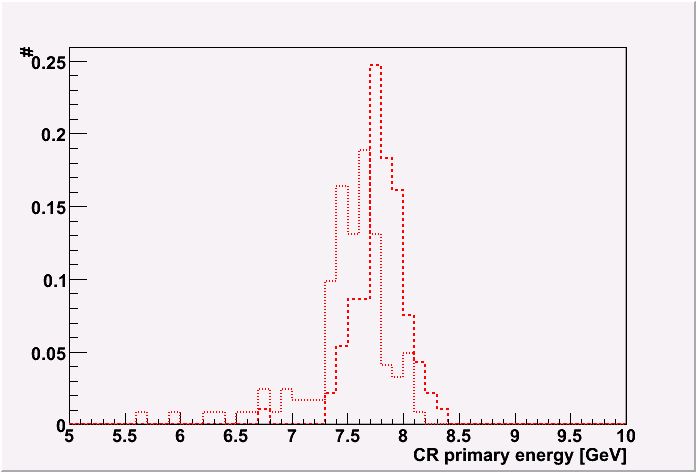
Here, I show a CR primary energy distributions for a fixed bundle energy (10^5 GeV).
As mentioned before, since the muon generation threshold is higher for my sample,
the CR energy also becomes higher. The difference of peak position is about
10^0.2 ~= 60%.
This means that we should be careful to define the "bundle energy". It depends on the generation threshold. (Although the low energy threshold is not preferable for the EHE MC genration. It takes too much time.)
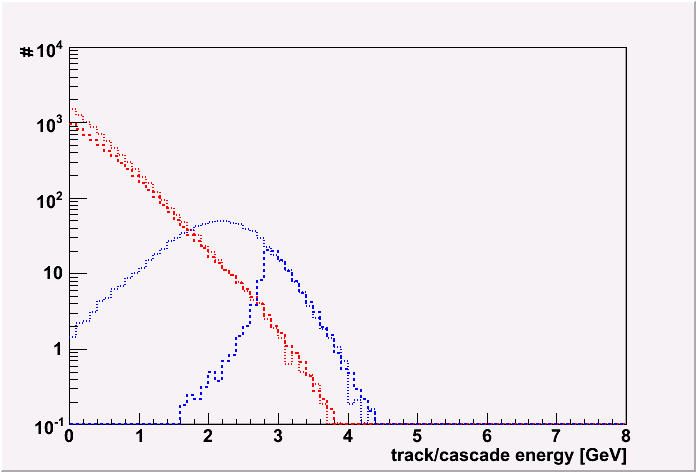
I also shows the track/cascade energy distributions for a bundle with the
fixed CR primary energy of 10^8 GeV. As seen, the track distributions are same except the low energy side.
|
Energy distribution of CR primary energy for a bundle of 10^5 GeV
red: cascade, blue: track
dot: corsika, small dot: corsika(Henrike)
|
Energy distribution in a bundle with the fixed primary energy of 10^8 GeV
red: cascade, blue: track
dot: corsika, small dot: corsika(Henrike)
|
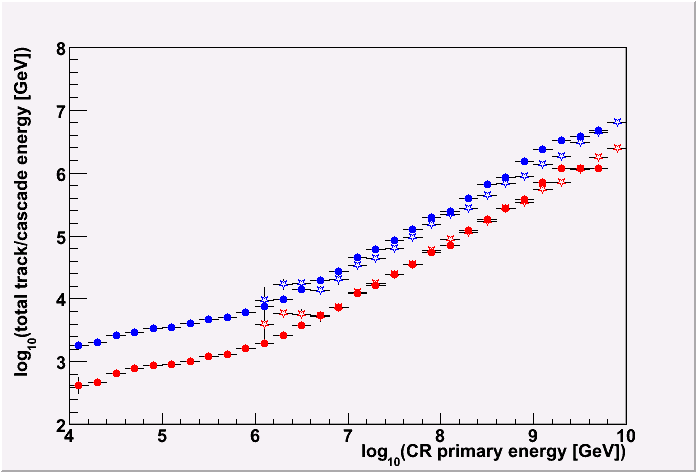
Finally, I also put a plot showing the relation of sum of cascade energy from a bundle Vs the CR primary energy.
As seen, here the cascade energy sum for a CR energy is same for corsika samples.
This means that the muon generation threshold (1 TeV) doesn't affect on
the total cascade energy.
However, the 1 TeV threshold for the muon generation is not enough
for the tracks. As you see, we underestimate the energy a bit (~60%).
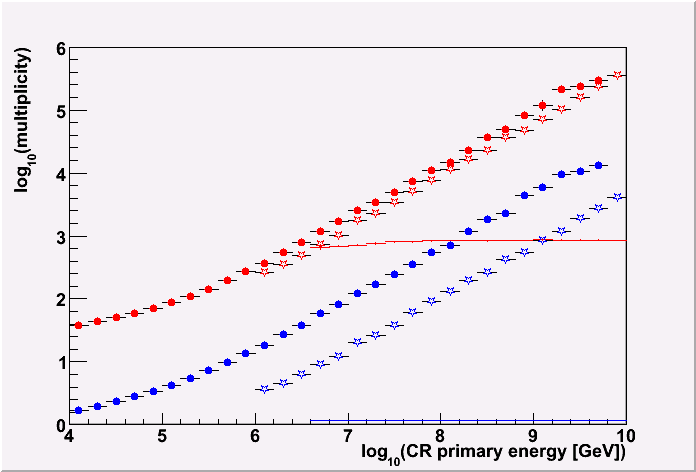
Moreover, we will underestimate the multiplicity of tracks with the high
threshold, and leads to a substantial underestimate for Npe (~factor 3.7).
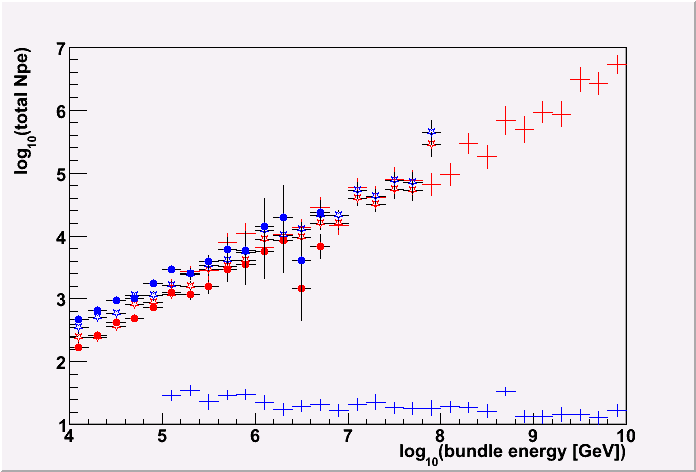
The Npe Vs bundle energy is also shown here. Although the statistics is
not enough, it's a bit difficult to check the relation between samples, but
you clearly see that there is a certain amount of Npe's from bare tracks
for corsika samples.
|
Sum of cascade energy from a bundle Vs CR primary energy
red: cascade, blue: track
dot: corsika, small dot: corsika(Henrike)
|
total Npe Vs the bundle energy
blue: tracks, red: cascades
line: juliet, star: corsika, circle: corsika(Henrike)
dist < 400m
|
|
multiplicity
blue: juliet, red: corsika(at Chiba), green: corsika(Henrike's)
|
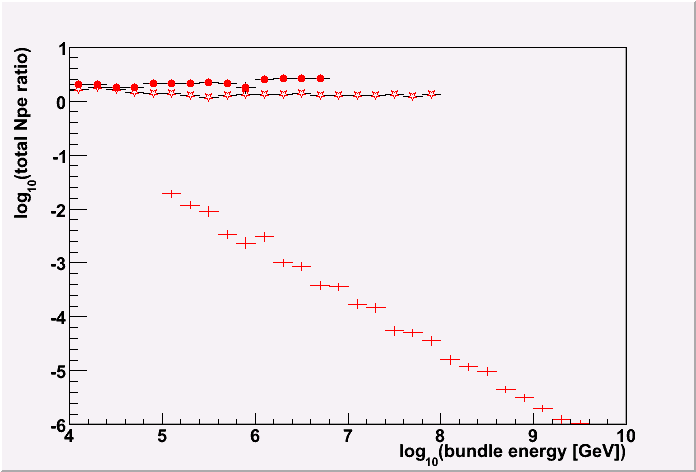
Ratio of contribution between tracks and cascades
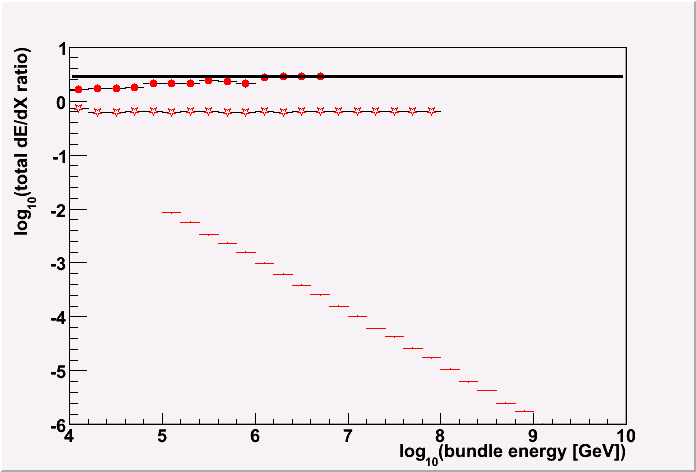
I show here the ratio of contribution between tracks and cascades.
In the left plot below, the ratio of the theoritical dE/dX (ionization loss / loss by radiative process)is shown.
As seen, in case of Henrike's corsika dataset the track contribution is 2.92 times larger than that of cascades. In case of corsika dataset I generated, it underestimate the contribution from tracks due to lack of (many) low energy tracks.
I also plotted Npe ratio between tracks and cascades (Npe(track)/Npe(cascade))
in the right plot below.
In case of Henrike's dataset the contribution
from track is 2.66 times higher than that from cascade in Npe.
|
Ratio of total theoritical dE/dX between radiative process and ionization loss
line: juliet, star: corsika, circle: corsika(Henrike)
|
Ratio of Npe between from cascade and tracks.
line: juliet, star: corsika, circle: corsika(Henrike)
|
Comparison with observational data
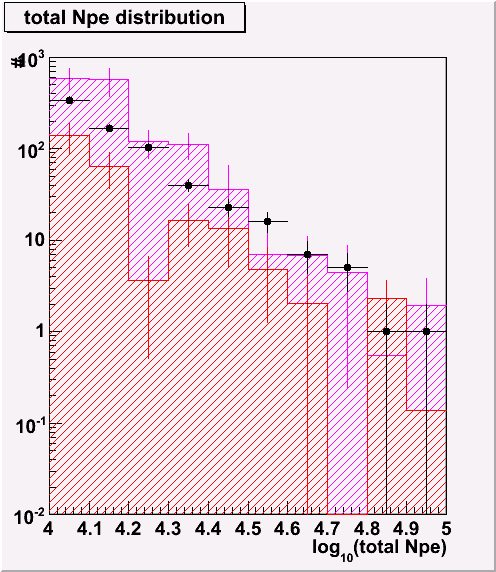
At last, the Npe distributions are shown with the observational data.
The Npe distribution for corsika data with the low energy threshold seems to
agree with the observational data (though, the statistics is low).
|
Npe distributions (with corsika data generated by Henrike W.) (zenith angle (FG) < 10 deg.)
blue: tracks, red: cascades
line: juliet, star: corsika, circle: corsika(Henrike)
|
misc
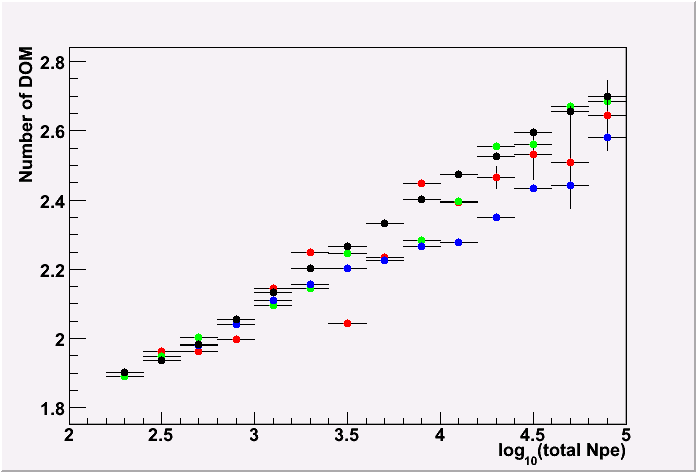
NDOM Vs Npe
By taking into account the tracks, the agreement between MC and data becomes
better for the NDOM Vs Npe .
|
NDOM Vs Npe
black: obs. data, blue: juliet, red: corsika(at Chiba), green: corsika(Henrike's)
|

Summary
- Contribution from tracks is substantial.
- We should be carefule to define the "bundle energy".
- The corsika dataset with the low energy muon generation samples agrees
with the observational data.
- We may be able to take into account the track effect separately,
because the Npe ratio between track and cascades doesn't depend on the bundle energy
(primary energy) so much. We need more investigation for this.

Keiichi Mase
Last modified: Thu Aug 28 19:53:39 JST 2008


