Channel-wise ATWD NPE distribution
It was found by Mio that ATWD channel-wise NPE doesn't match between data and MC as shown in this page. I also checked this by myself and the distribution is shown below. One see a difference around ATWD NPE = 103.
|
Channel-wise ATWD NPE distribution
|
Channel-wise ATWD distributions of used ATWD channel are also plotted below both for data and MC as Mio did. One see that the difference of channel-wise ATWD distribution comes from one of ch2 (the lowest gain of ATWD as shown with red). Note that ch2 (the lowest gain) is used when signal is large in order to suppress saturation due to dynamic range.
|
Channel-wise ATWD NPE distribution 
|
Channel-wise FADC NPE distribution 
|
As shown previously, the difference between data and MC comes from ch2 difference. Therefore, the gain mis-calibratoin of ch2 was suspected. Mio pointed out that in order to explain the ATWD NPE distribution, gain mis-calibration of factor 2 is needed (which seems to be quite large to happen).
In order to check the gain calibration, correlatioin of NPE between ch1 and ch2 (and ch0 and ch1) are taken and shown below.
There is a deviation at large NPE, but this is normal behaviour since higher gain channel produces less NPE due to the dynamic range. One can see good correlations of NPE between ch1 and ch2 (and ch0 and ch1) at low NPE region. These results are consistent with one for IC22 data as shown here (Note that x and y axis is other way around. Sorry.).
Therefore, the ch2 gain is calibrated correctly.
|
Channel-wise ATWD NPE Correlation 
|
Channel-wise ATWD NPE Correlation 
|
|
Channel-wise ATWD NPE Correlation 
|
Channel-wise ATWD NPE Correlation 
|
Channel-wise ATWD NPE distributions are plotted with several event-wise NPE cut. One sees better agreement as the event-wise NPE cut becomes higher above event-wise NPE = 103.6.
|
Channel-wise ATWD NPE distribution (NPE > 102.8) 
|
Channel-wise ATWD NPE distribution (NPE > 103.0) 
|
Channel-wise ATWD NPE distribution (NPE > 103.2) 
|
|
|
Channel-wise ATWD NPE distribution (NPE > 103.4) 
|
Channel-wise ATWD NPE distribution (NPE > 103.6) 
|
Channel-wise ATWD NPE distribution (NPE > 103.8) 
|
Channel-wise ATWD NPE distribution (NPE > 104.0) 
|
Distributions with differential event-wise NPE cuts are shown below. One can clearly see that differences are large at low (event-wise) NPE and good agreement at high NPE.
The difference at low event-wise NPE is probably due to lack of low energy events that are not simulated (ECR < 106GeV). Such low energy events that accidentaly make huge event-wise NPE are missed in simulation. In order for such low energy events to pass the EHE filter criteria of event-wise NPE greater than 102.8, they have to give huge amount of light to a single DOM since they are typically dim. Thus, the difference appears only in ch2.
|
Channel-wise ATWD NPE distribution (NPE > 102.8-3.0) 
|
Channel-wise ATWD NPE distribution (NPE > 103.0-3.2) 
|
Channel-wise ATWD NPE distribution (NPE > 103.2-3.4) 
|
|
Channel-wise ATWD NPE distribution (NPE > 103.4-3.6) 
|
Channel-wise ATWD NPE distribution (NPE > 103.6-3.8) 
|
Channel-wise ATWD NPE distribution (NPE > 103.8-4.0) 
|
In order to confirm the simulation bias, CR primary energy distributions with several event-wise NPE cuts are shown below.
There is also a bias on event-wise total NPE due to the limited energy range of simulation. The effect of the bias disappears above total NPE greater than 103.2. The same distributions for events that use ch2 are also shown with dashed lines. In this case the effect of bias seems to be severer, and in order to get free from the bias, the event-wise total NPE cut shall be greater than 103.4-3.6. On the other hand, there are not so many events that use ch2. The rate is 2 order of magnitude smaller compared to others. As far as total NPE is used in an analysis, the effect of ch2 doesn't seem to be so strong, however, in case one use channel-wise information, this effect will have to be considered carefully.
|
CR primary energy distribution 
|
CR primary energy distribution 
|
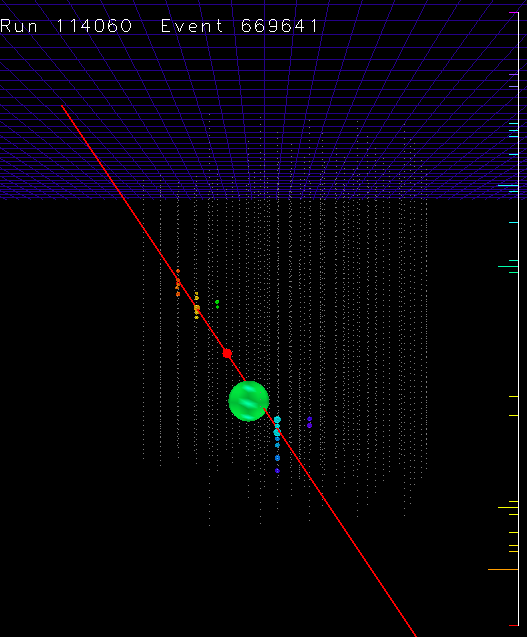
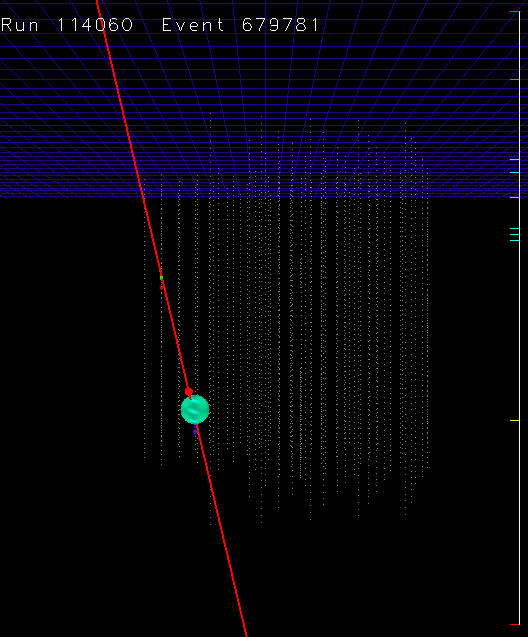
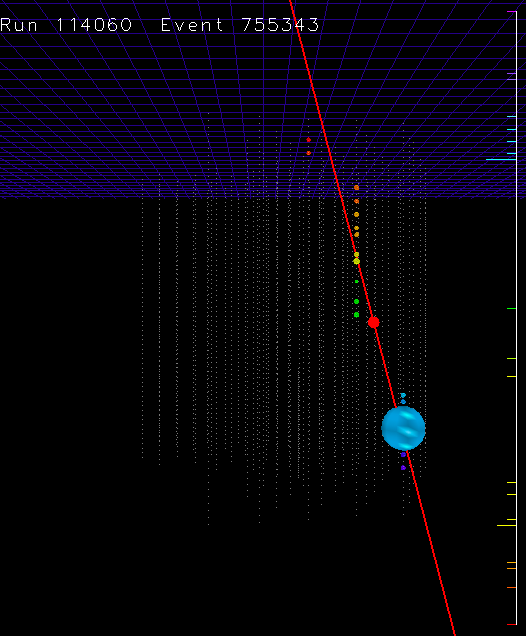
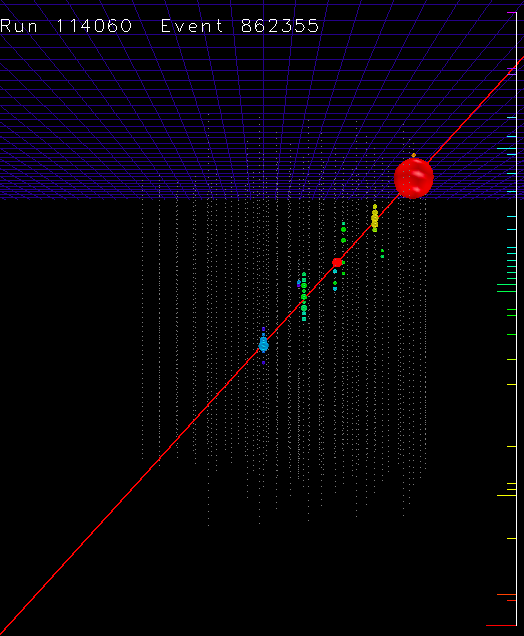
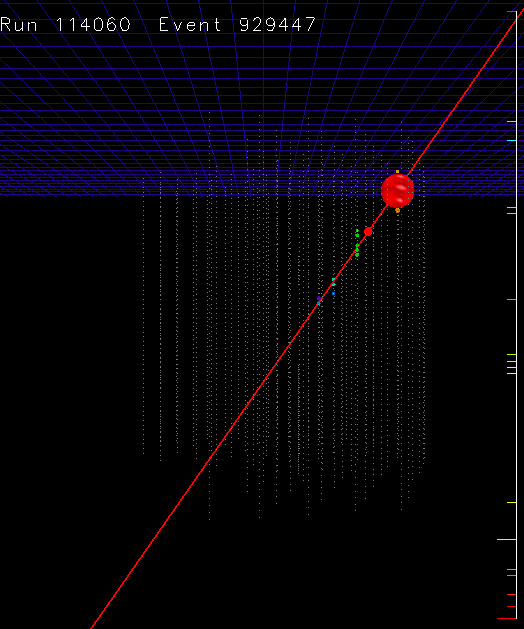
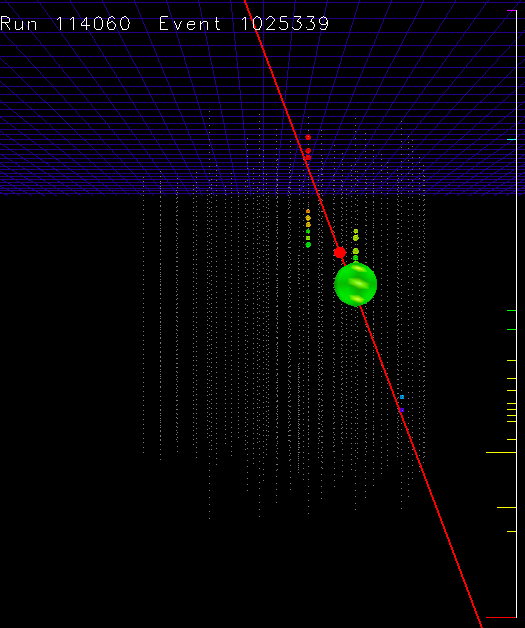
I also check events by a viewer that placed in ATWD NPE region where the difference between data and MC exist with a condition of total event-wise NPE < 103 and channel-wise ATWD NPE > 7x10². Randomly selected six events are shown below.
All events give huge amount of lihgt to a single DOM as expected. (balloon events in Kotoyo's word) Such events are not simulated in HE CORSIKA since the starting energy is relatively high (> 106 GeV)
|
|
|
|
|
|
Keiichi Mase Last modified: Sat Dec 19 03:59:27 JST 2009