SC Study
IceCube/EHE Search
/9-string analysis
Standard Candle Event Study for EHE analysis
From previous study, I found the largest uncertain in estimated NPE
for each DOMs is from uncertainty in baseline estimation.
Tried in this page is that more systematic study of baseline using standard
candle sample.
Standard candle events includes both DOMs with large pulses and
small pulses, it is good place to study for finding reasonable baseline estimation from realdata which may be different from MC as MC does not include baseline fluctuation.
Note that ATWD and FADC are however read out full which is different
from EHE 9 string analysis sample. The effect from reduced bin
especially for FADC will be considered later using BinReducer module
applied on the real data.
Then obtained estimated NPE with reduced bin with REDUCED bins will be our scaler for event energy.
Another note is that we make use of the point that if ATWD baseline is
incorrectly estimated by 1mV, this corresponds to the NPE values of
NPE_error = 1(mV)*3.3(ns)*128(bin)/43(ohm)/1.6(pC) = 6.1 pe
and for FADC
NPE_error = 1(mV)*25(ns)*256(bin)/43(ohm)/1.6(pC)=93 pe with full
readout and
NPE_error = 1(mV)*25(ns)*50(bin)/43(ohm)/1.6(pC)=18 pe with current
realdata default readout.
For a large pulse, the larger npe, the smaller the relative error from this mis-estimation.
As for the event-wise npe sum, ehe-event npe sum is mainly determined by those large pulse DOMs.
Now I have 4 options to be studied.
- A) zero
- B) Iteration
- C) Average of the lowest quarter bins
- D) Average of first or last 3 bins whichever gives smaller value
We know that selecting one of these options doesn't work good enough for SC events as it includes large and small pulses.
Also, ATWD and FADC expect different behavior because of the differences in time range, gain, and baseline shift properties.
Reason for option D) is that we know first 3 bin average for ATWD already contains a part of pulse. Thus a baseline tends to appear a little large. The last 3 bins we don't know if there is a pulse or not, sometime there are but sometime not. Comparing these two values reduce probability to have baseline which obtained from averaged of first or last bins including large entries.
But as we'll see later, for FADC, we don't have problem for this pre-pulse region. Thus for FADC we study only the average of the FIRST 3 bins.
This page studies what's the best combination.
Then as I will introduce later in this page, I compare the results with option E) the first 2 bin average.
As this page has become too heavy, FADC baseline is studied in the next page
FADC Baseline
Short summary is here,
|
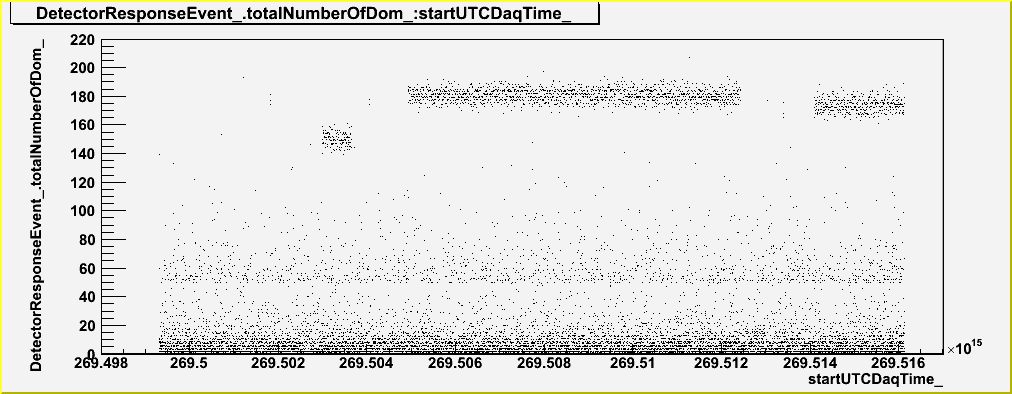
At first let me show the plot of which x-axis is start time of the
event and the y-axis is Nch. This plot show which run is 100% run.
In the plots below 100% run defined as
startUTCDaqTime_ larger than 26.95045*1e16
&&
startUTCDaqTime_ smaller than 26.95125*1e16
&&
Nch>160
|
ATWD - string inclusive
Obtained baselines from different options for different strings.
From the top, the closest to SC string (the same string) and the
lower, the away from the string, thus the expected pulses or NPEs are
decreased.
|
Obtained baseline distributions with 4 options for 100% SC
runs from string-40 (the same string as SC)
From Left A) zero, B) iteration, C) lowest average D) first or last

|
|
string-39
From Left A) zero, B) iteration, C) lowest average D) first or last

|
|
string-29
From Left A) zero, B) iteration, C) lowest average D) first or last

|
|
string-21
From Left A) zero, B) iteration, C) lowest average D) first or last

|
|
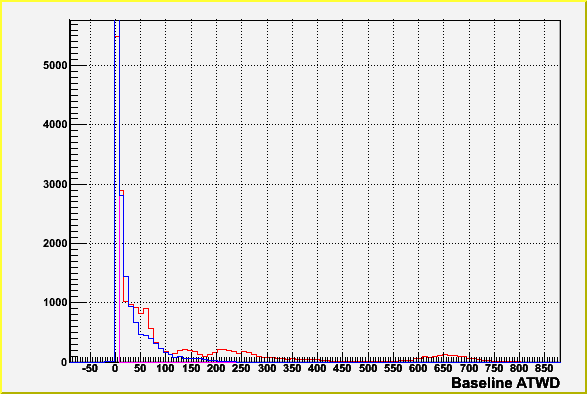
Obtained baseline distributions with 3 options for 100% SC except zerobase
runs from string-40 (the same string as SC)
Red-B) iteration, Blue-C) lowest average, Pink-D) first or last
|
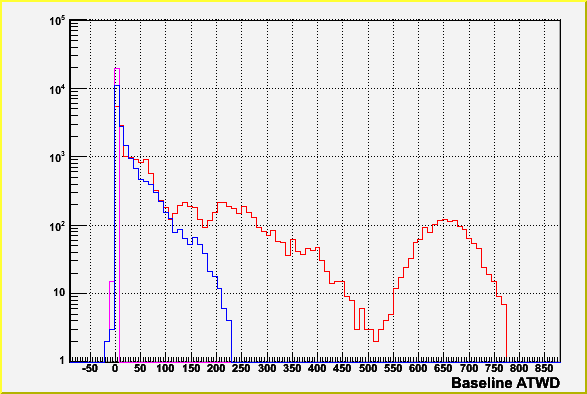
Obtained baseline distributions with 3 options for 100% SC except zerobase
runs from string-40 (the same string as SC)
Red-B) iteration, Blue-C) lowest average, Pink-D) first or last
|
|
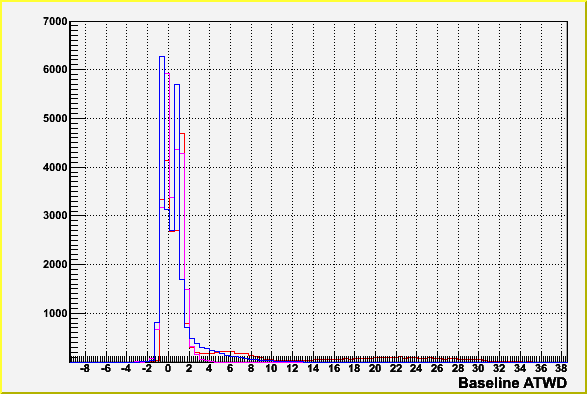
Obtained baseline distributions with 3 options for 100% SC except zerobase
runs from string-39 (the same string as SC)
Red-B) iteration, Blue-C) lowest average, Pink-D) first or last
|
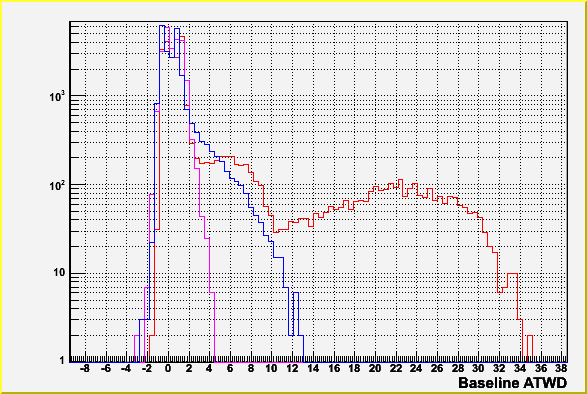
Obtained baseline distributions with 3 options for 100% SC except zerobase
runs from string-39 (the same string as SC)
Red-B) iteration, Blue-C) lowest average, Pink-D) first or last
|
|
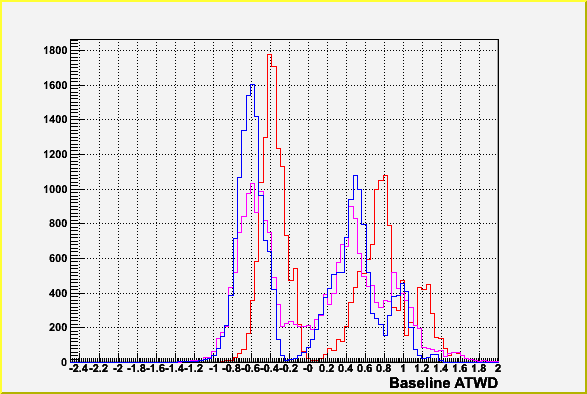
Obtained baseline distributions with 3 options for 100% SC except zerobase
runs from string-29 (the same string as SC)
Red-B) iteration, Blue-C) lowest average, Pink-D) first or last
|
|
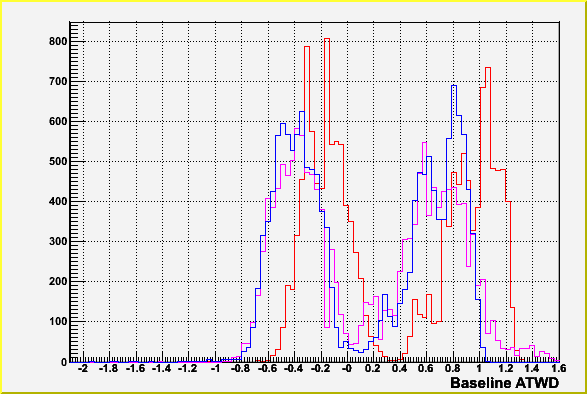
Obtained baseline distributions with 3 options for 100% SC except zerobase
runs from string-21 (the same string as SC)
Red-B) iteration, Blue-C) lowest average, Pink-D) first or last
|
ATWD - DOM-wise for each strings
The same as above but as functions of DOM number
|
Obtained baseline distributions with 4 options for 100% SC
runs from string-40 (the same string as SC)
From Left A) zero, B) iteration, C) lowest average D) first or last

|
|
string-39
From Left A) zero, B) iteration, C) lowest average D) first or last

|
|
string-29
From Left A) zero, B) iteration, C) lowest average D) first or last

|
|
string-21
From Left A) zero, B) iteration, C) lowest average D) first or last

|
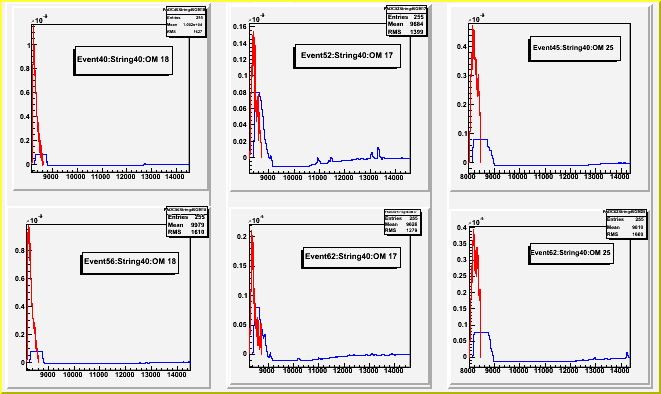
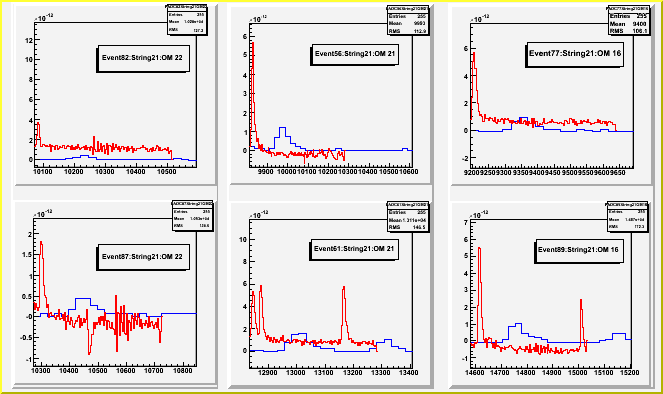
Typical Waveforms
Now I'd like to come back to typical waveforms for each
string-doms to check what should be the baseline.
|
string-40, scaled to FADC time range
From Left 1) DOM 18, 2)DOM 17, 3) DOM 25
|
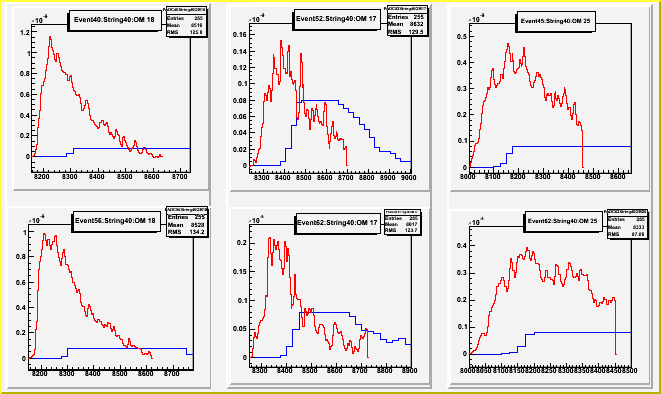
string-40, scaled to ATWD time range
From Left 1) DOM 18, 2)DOM 17, 3) DOM 25
|
|
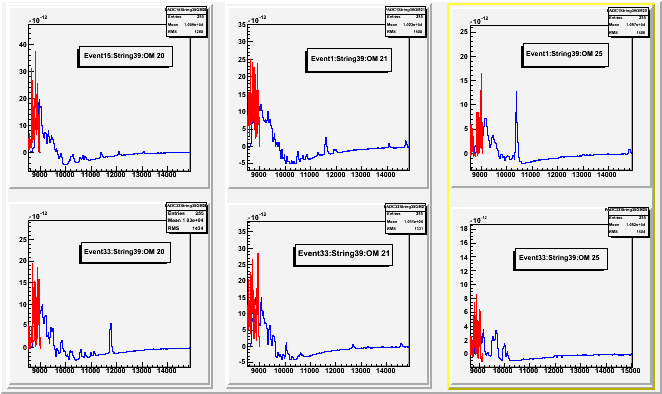
string-39, scaled to FADC time range
From Left 1) DOM 21, 2)DOM 20, 3) DOM 25
|
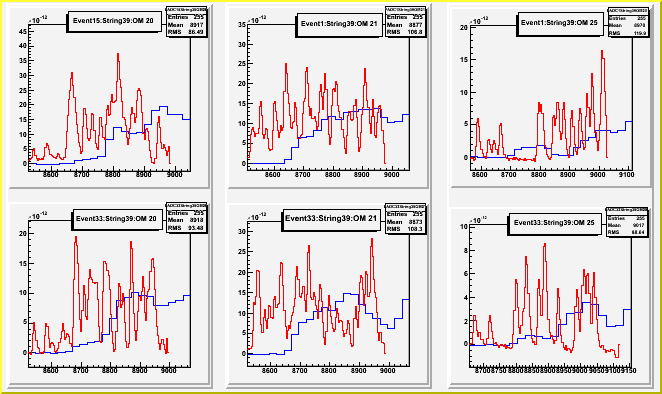
string-39, scaled to ATWD time range
From Left 1) DOM 21, 2)DOM 20, 3) DOM 25
|
|
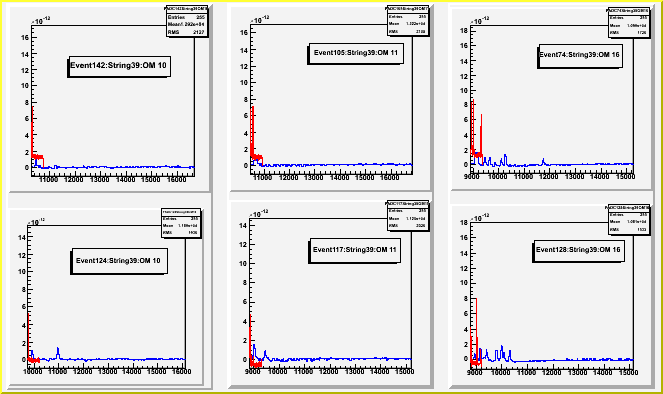
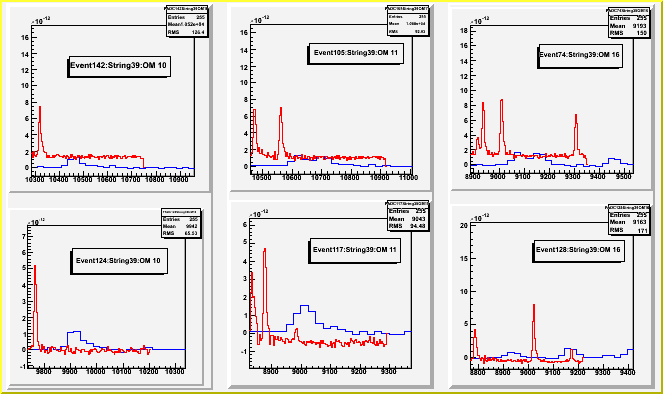
string-39-GDOMs, scaled to FADC time range
From Left 1) DOM 10, 2)DOM 11, 3) DOM 16
|
string-39 GDOMs, the same as left different x-axis scale
From Left 1) DOM 10, 2)DOM 11, 3) DOM 16
|
|
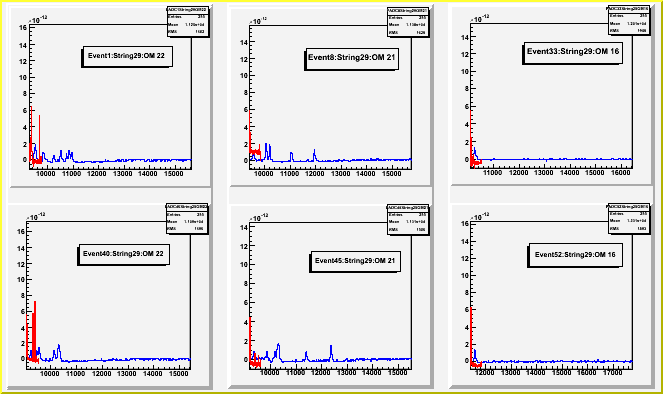
string-29, scaled to FADC time range
From Left 1) DOM 22, 2)DOM 21, 3) DOM 16
|
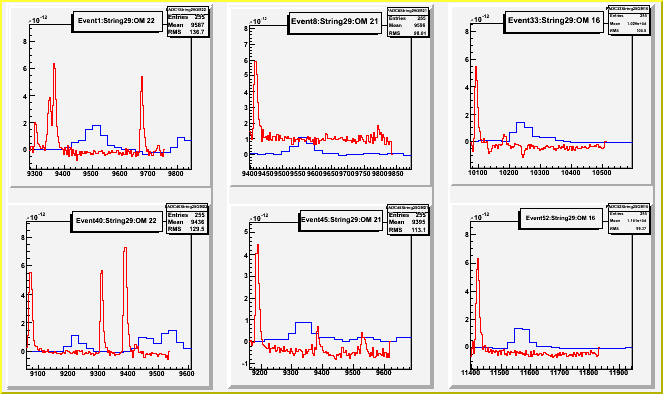
string-29, scaled to ATWD time range
From Left 1) DOM 22, 2)DOM 21, 3) DOM 16
|
|
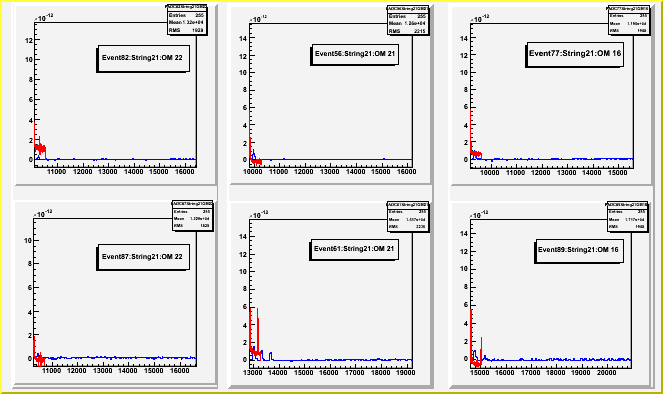
string-21, scaled to FADC time range
From Left 1) DOM 22, 2)DOM 21, 3) DOM 16
|
string-21, scaled to ATWD time range
From Left 1) DOM 22, 2)DOM 21, 3) DOM 16, the same as left different x-axis scale
|
Finally estimated NPE from each baseline option
This can be compared by-eye with the waveforms.
|
String-40
From Left, baseline option A), B), C) and D)

|
|
String-39
From Left, baseline option A), B), C) and D)

|
|
String-29
From Left, baseline option A), B), C) and D)

|
|
String-21
From Left, baseline option A), B), C) and D)

|
First-or-Last option or just first option
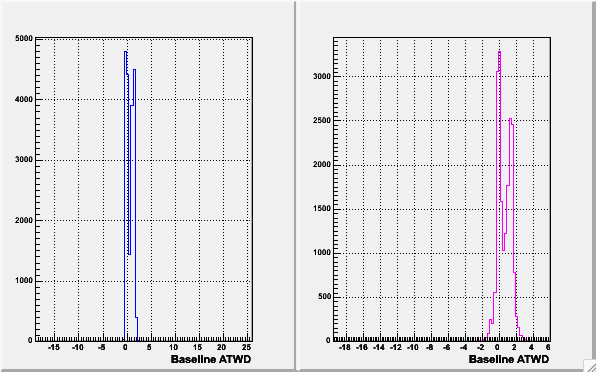
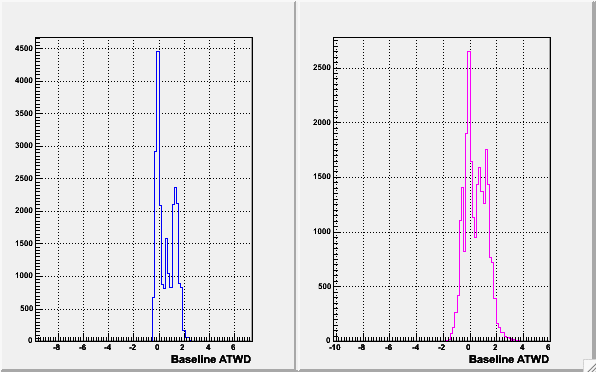
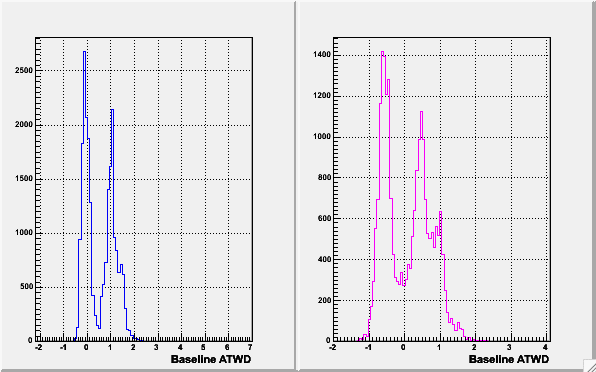
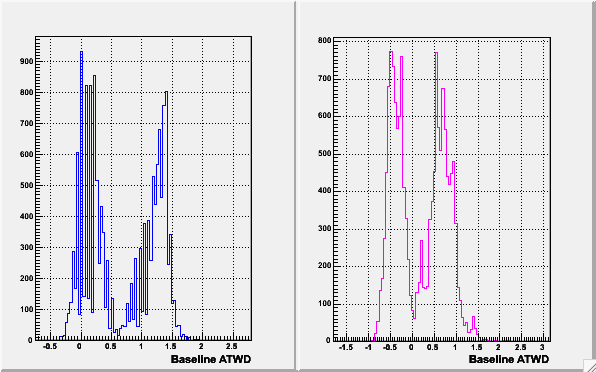
However when I took a close look at each waveforms, now I don't see advantage on the option D) over the option E) which is just average of a first few bins, with existnace of undershoot.
Also generally there is not much pre-pulse flat region for ATWD. Here I compare First 2 bin average and either first or last 3 bin.
|
String-40
From Left, first 2bin ave. E) and D)
|
|
String-39
From Left, first 2bin ave. E) and D)
|
|
String-29
From Left, first 2bin ave. E) and D)
|
|
String-21
From Left, first 2bin ave. E) and D)
|
Difficult Waveforms
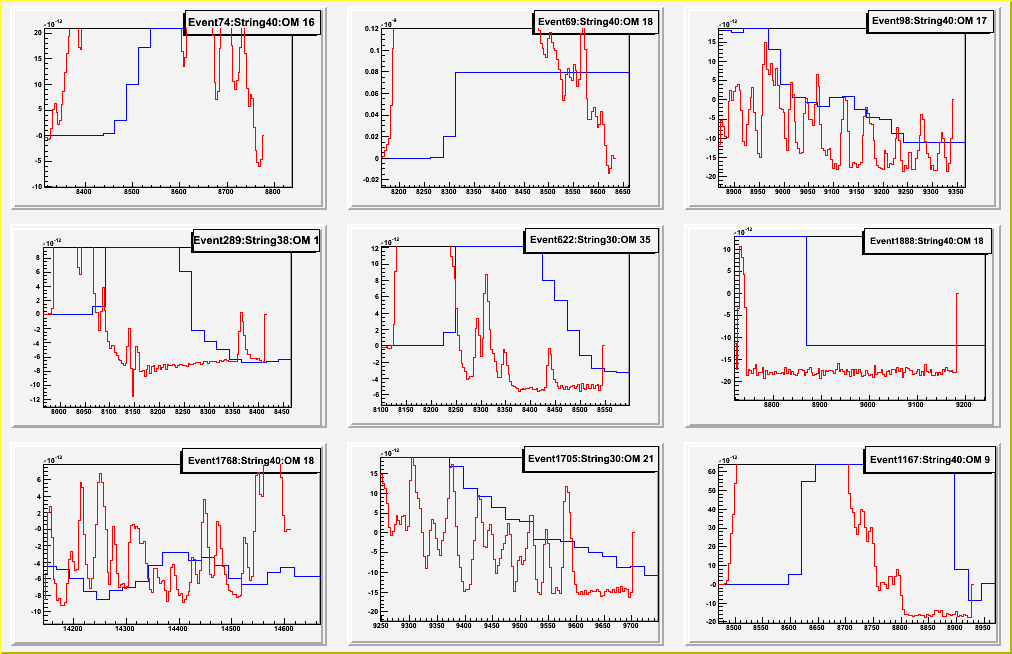
Waveforms with first or last 3 bin average gives less than negative 5mV to check the value obtained by the option is consistent with waveforms.
Turns out it may be real, generally it seems to be due to ATWD undershoot.
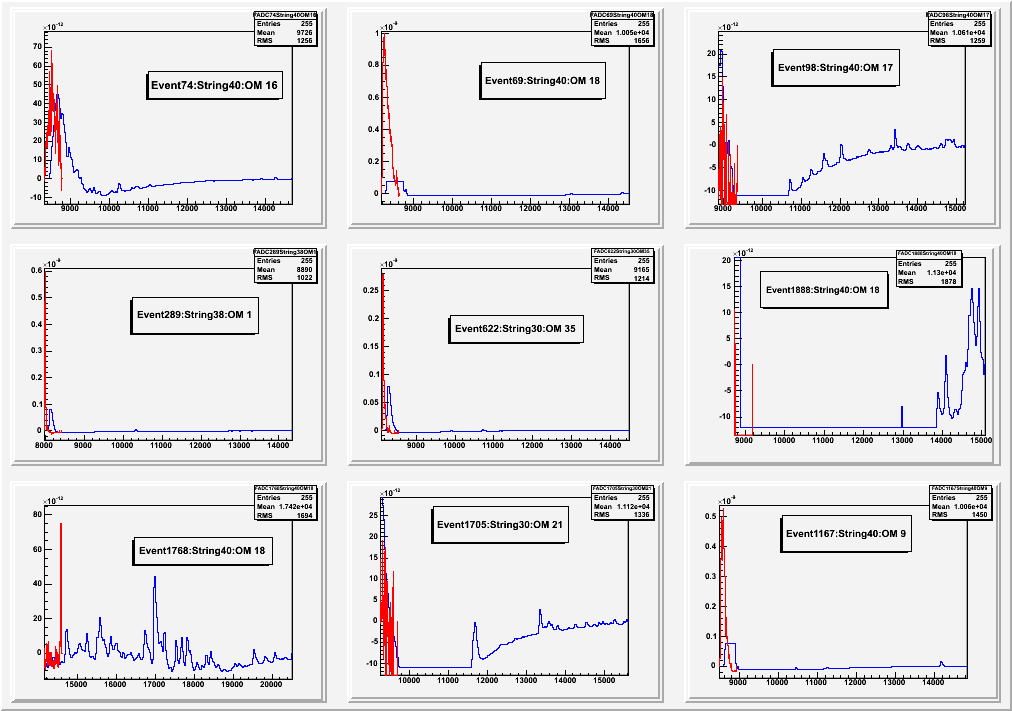
However those waveforms shown below, 4 out of 9 plots, there is no pre-pulse flat region for FADC.
This is different from what we see in the other plots...
It seems this suggests that DOMLaunch time is late and what we see as baselines are under effect of undershoot.
This gives a large negative baseline value.
|
Waveforms with first or last 3 bin average gives less than negative 5mV.
to check the value obtained by the option is consistent with waveforms.
|
|
The same but scaled to FADC time range
|
For ATWD,
- For the small pulses, all the 3 options B), C) and D) gives
similar values.
- However the option B) iteration, gives slightly larger baseline,
this is reasonable because the option C) the average of the lower quarter bins, gives smaller value as it should be, and we consider the iteration procedure gives the best baseline for small pulses as studied in hardware calibration.
- There is a double peak structure in the ATWD baseline distribution at -0.4 ~ -0.2mV and at 0.8 ~ 1.0 mV.
This may come from ATWD ping-pong channel selection.
- The most stable baseline estimator for from the largest pulse to
the smallest pulses is option E) the first 2 bin average, with the assumption that ATWD baseline can be approximated as NPE independent.
- The other stable baseline option D) has some denger as it is more sensitive to undershoot.
- The option A), use of zerobaseline for ATWD, would result in error of about +6 ~ -3 pe.
For ATWD,
- Take option E) first 2 bin average.
- if the value is smaller than -1mV, larger than 2mV, take option A) i.e., consider the baseline as 0mV
- Then calculate NPE.
- If the obtained baseline non-zero and NPE value is less than 20, use the option 2) the iteration method.
The value npe=20 is obtained by plotting baseline vs. obtained npe and remove close DOMS which shows baseline-npe correlation.
For string39, the DOM # less than or equal to 17 corresponds to it.
For string40, the DOM # less than or equal to 12 corresponds to it.
And all doms on the other strings are subject of iteration method.
Now to be continued to the case of FADC...
go to FADC Baseline study
NPE Results - using new optimized baseline estimation
go to NPE results
send your comments to: aya at hepburn.s.chiba-u.ac.jp


