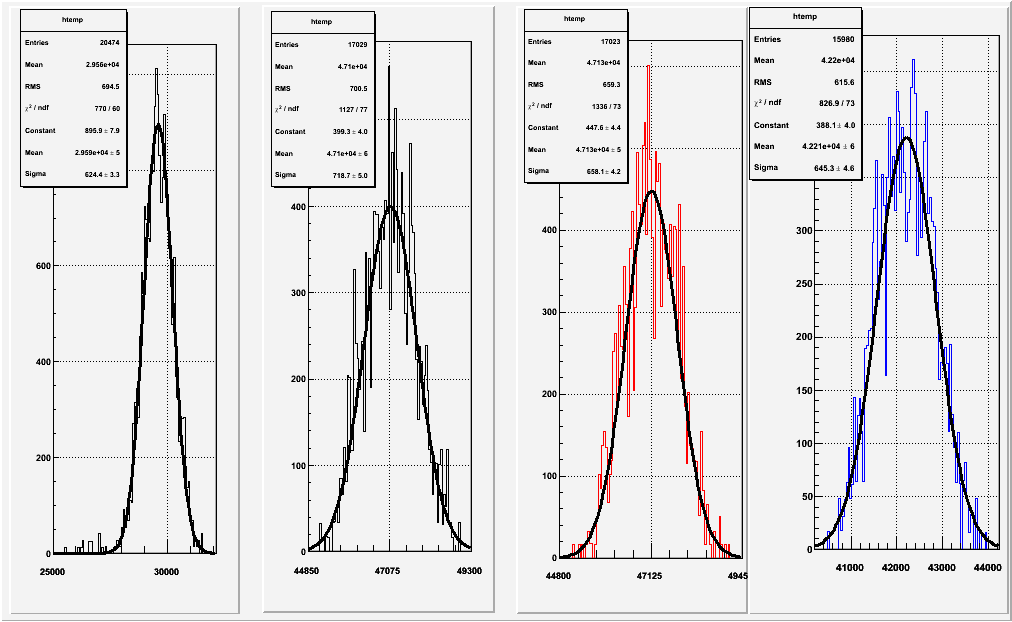
The figs to compare experimentaly measured NPE event sum value distribution from SC.
Number of bin is reduced as it matchs to that of 2006 physics run configuration.
The left black histogram is that from experimental measurement.
Then the other 3 hists are that of simulation. Difference in 3 hists is solely from hole ice parameter in photonics from left scattering length of 10cm (Black, maximum scattering), 50cm (Red) and 100cm (Blue, minimum scattering).
RealData's mean value is 29560, MC mean values from 10cm, 50cm 100cm are 47100, 47130 and 4220 respectively.
This gives Real/MC ratio for 9 string data to be 0.6276, 0.6272 and 0.70 respectively.

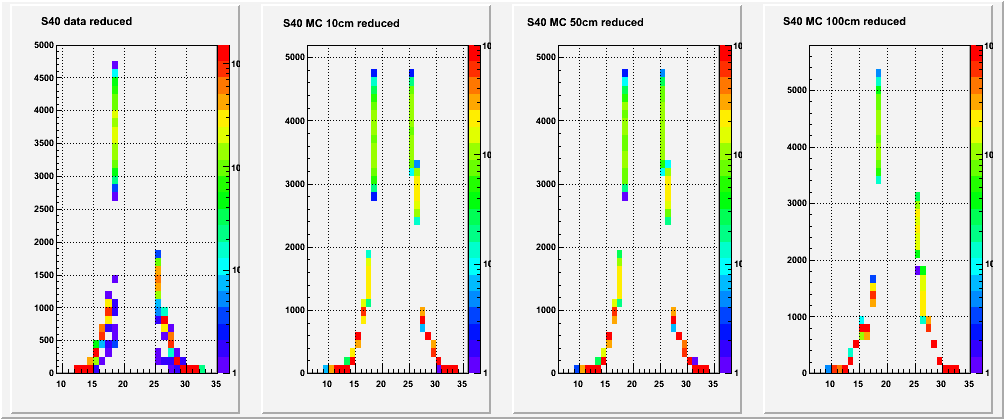
String 40 only Number Of NPE from ATWD as a function of DOM number with number of bin reduced
One can see that the hole ice scattering difference from 10cm to 100cm, the main difference comes to lower DOMs.
The more the scattering (the less the scattering length), the more the backword DOM NPEs.
10cm to 50cm change induce very small increase in the lower DOM NPEs and from 50cm to 100cm change makes quite large effect for backword, while no significatn change in NPEs in forward near DOM.

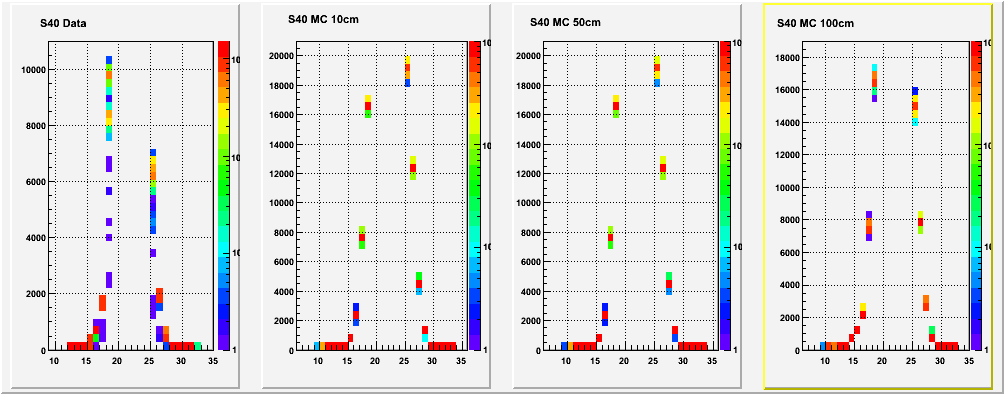
String 40 only Number Of NPE from ATWD as a function of DOM number BUT now bin number is NOT REDUCED
Similer observation can be made.
But forward region NPE difference is larger.
This can not be exprained by hole ice effect only, because experimental data of NPE ratio of om#18 and om#25 suggest the longer scattering length than 100cm but simulation already predict larger forward region NPE than data.

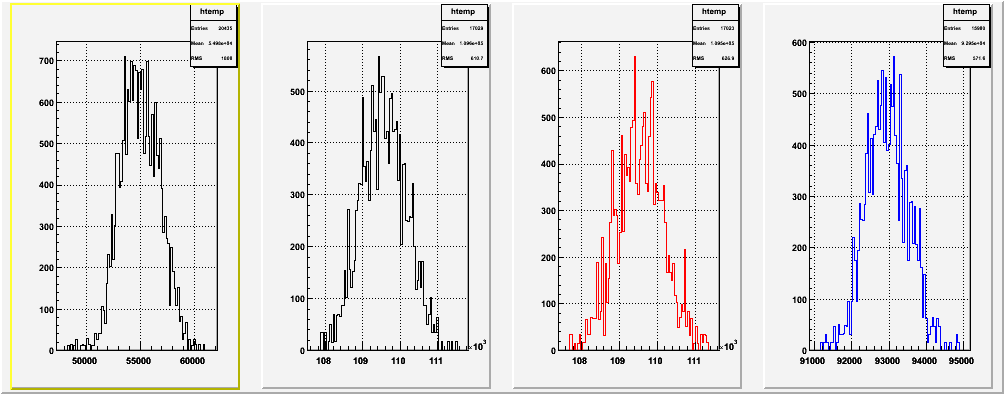
The figs to compare experimentaly measured NPE event sum value distribution from SC.
Here, Number of bin is NOT reduced.
The left black histogram is that from experimental measurement.
Then the other 3 hists are that of simulation. Difference in 3 hists is solely from hole ice parameter in photonics from left scattering length of 10cm (Black, maximum scattering), 50cm (Red) and 100cm (Blue, minimum scattering).
RealData's mean value is 54970, MC mean values from 10cm, 50cm 100cm are 109600, 109500 and 92950 respectively.
This gives Real/MC ratio for 9 string data to be 0.501, 0.502 and 0.591 respectively.
