PMT 2D Uniformity Scan
Rationale
The PMT response is mostly measured with perpendicular light incident on the middle of the photocathode. This measurement aims to characterize the PMT response over the whole photocathode relative to the behavior at the center.
This is done by comparing accumulated charges at each scan point to the center. Since we compare charges, this measurement is done at MPE level.
Setup
The PMT is mounted inside the 2D scan box as in the gain vs. HV scan. The
oscilloscope used is the R&S RTO1044 next to ratafia. Its settings for this
measurement can be found in Ayumis
sheet.
Aim for an average of 60-70 photoelectrons when setting the laser intensity.
Running the DAQ
The DAQ lives in a jupyter notebook, which is located at:
/home/icecube/measurements/daq/notebooks/2d_cathode_scan.ipynb
It records 200 DEgg waveforms for every scanpoint on a 2D grid in zenith and azimuth. The binning is very fine, with 72 bins in azimuth and 64 bins in zenith. The motors are automatically controlled and will return to the central position after the scan is done.
Analysis
To get an overview of commands to run for the analysis of the data, see:
/home/icecube/measurements/analysis/workspace/cathode_scan/README
First, the waveforms are processed, then tables for the uniformity scan are built. Finally, a 2D polar plot is made to show the uniformity of the cathode.
Show/Hide typical plot
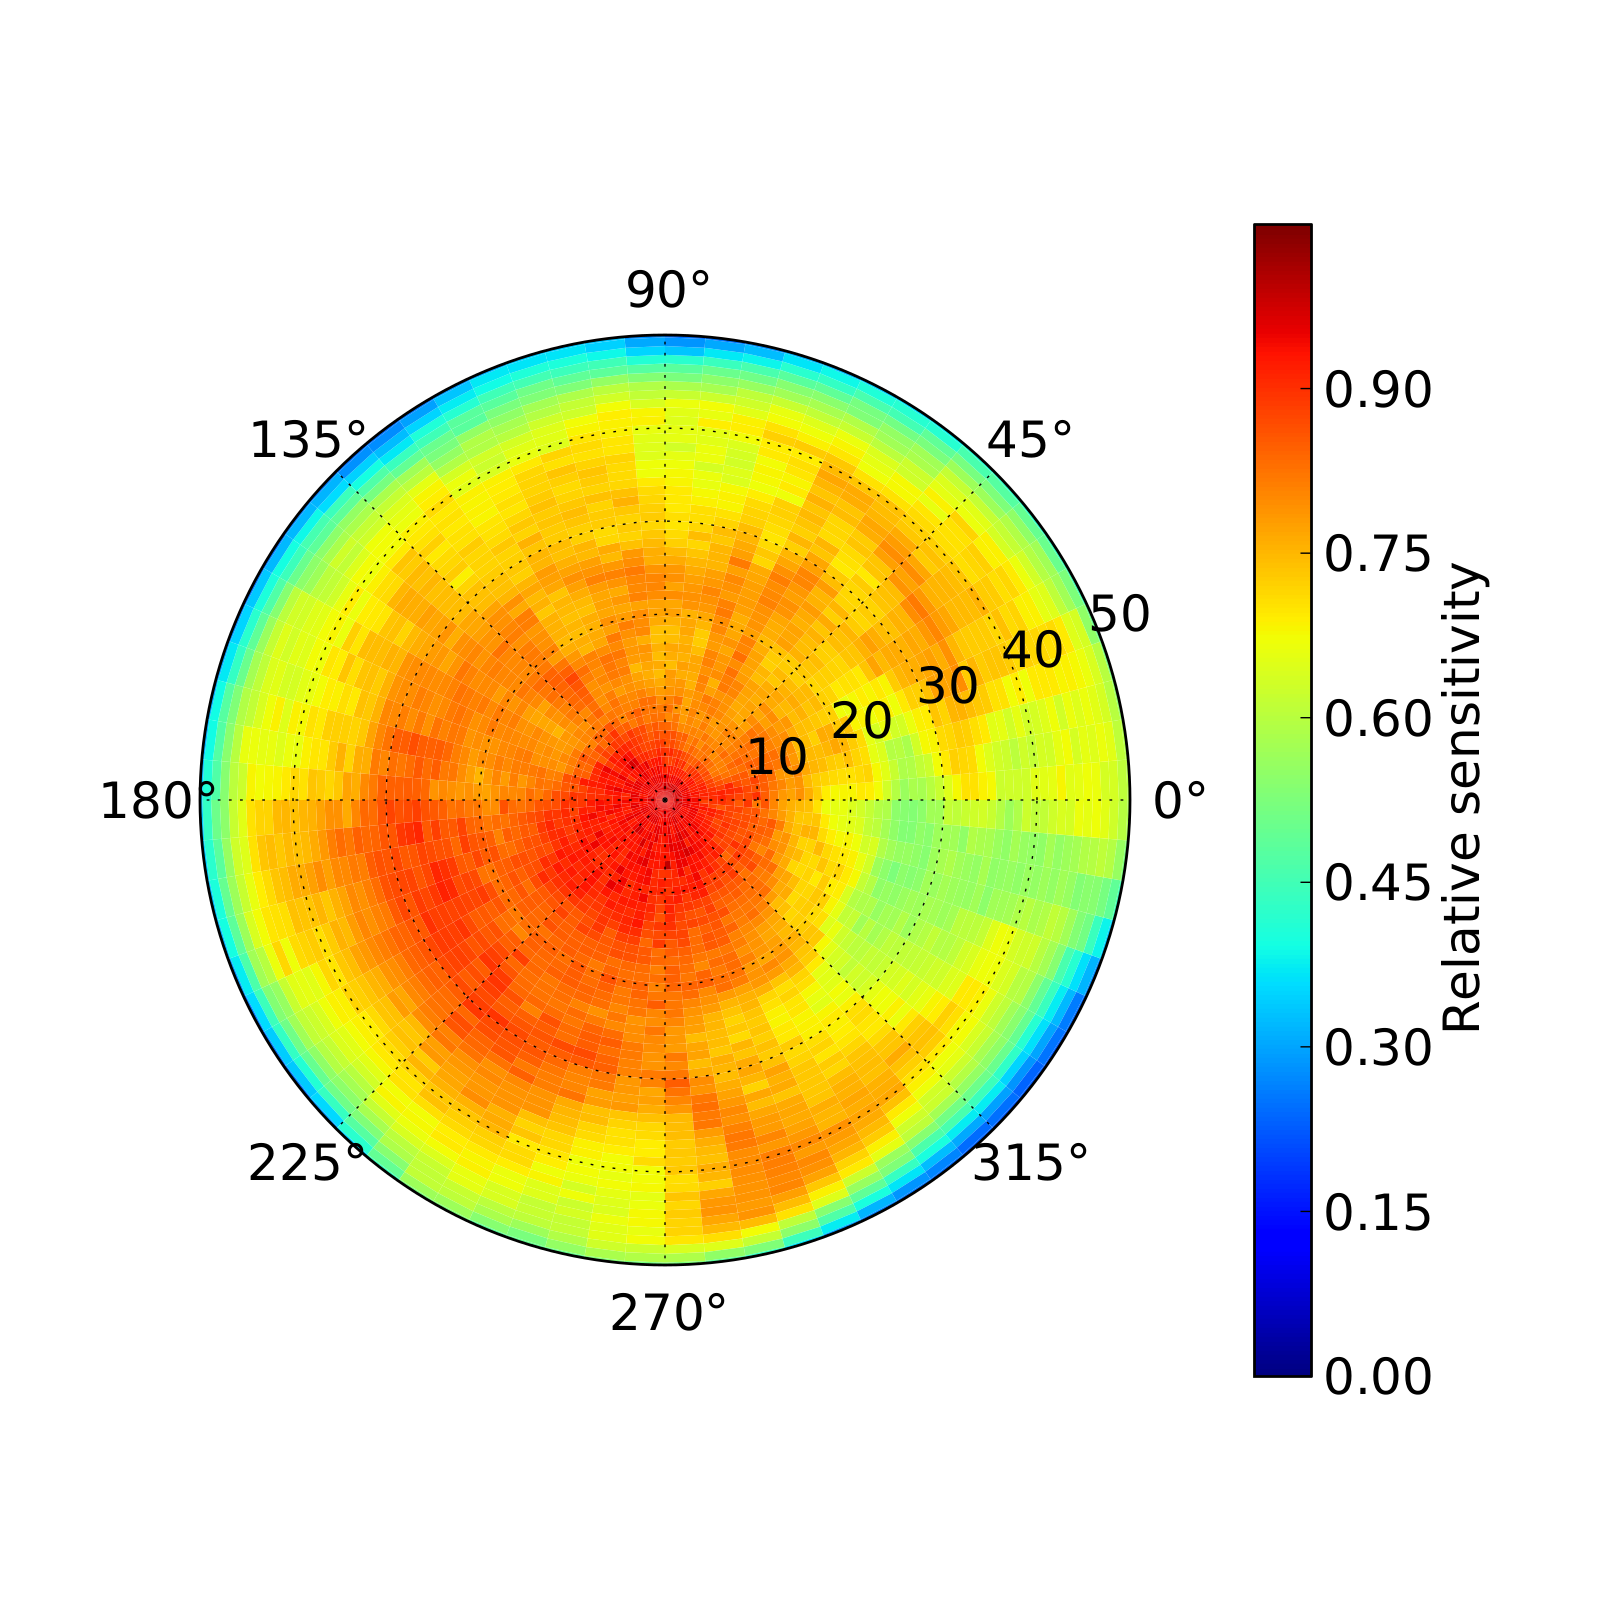
Fig. 26 Example polar uniformity plot